Fig. 9
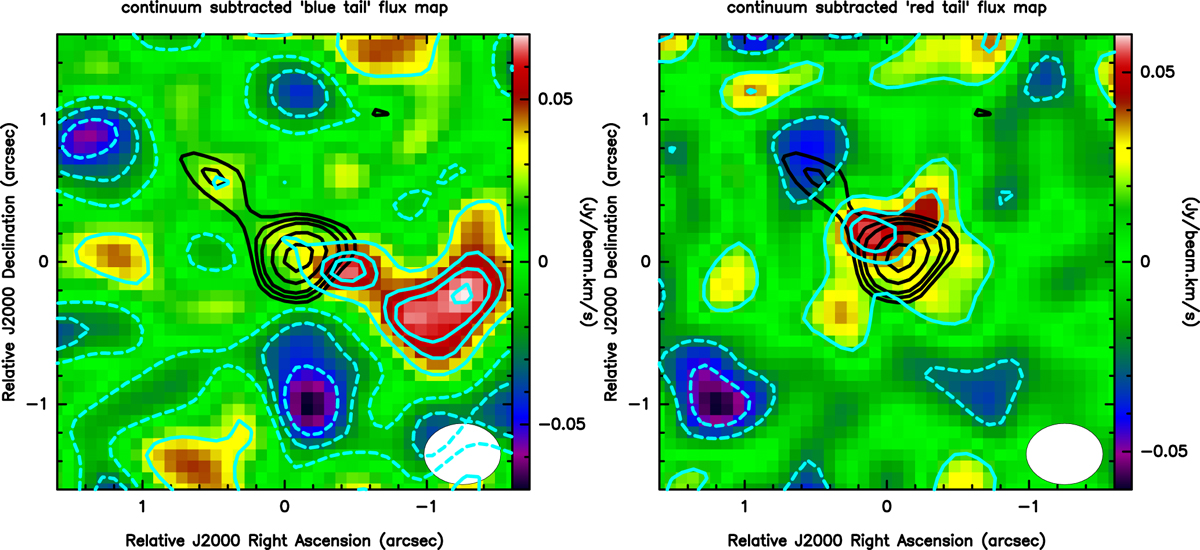
Flux maps extracted by collapsing the channels in the range [v < −350 km s−1] (blue tail; left panel), and [v > 350 km s−1] (red tail; right panel). The images are extracted from the natural flux maps to maximise the sensitivity to detect faint features. The cyan contours represent the sigma levels: −1, −2, −3 (dashed) 1, 2, 2.5, and 3 (solid; 1σ ~ 0.02 Jy km s−1). The black contours at 3, 4, 5, 7, and 9σ indicate the dust continuum emission (from Fig. 1). The beam ellipse is drawn in the lower right corner in both panels. The colour wedge gives the flux intensity scale in Jy km s−1 beam−1.
Current usage metrics show cumulative count of Article Views (full-text article views including HTML views, PDF and ePub downloads, according to the available data) and Abstracts Views on Vision4Press platform.
Data correspond to usage on the plateform after 2015. The current usage metrics is available 48-96 hours after online publication and is updated daily on week days.
Initial download of the metrics may take a while.