Fig. 7
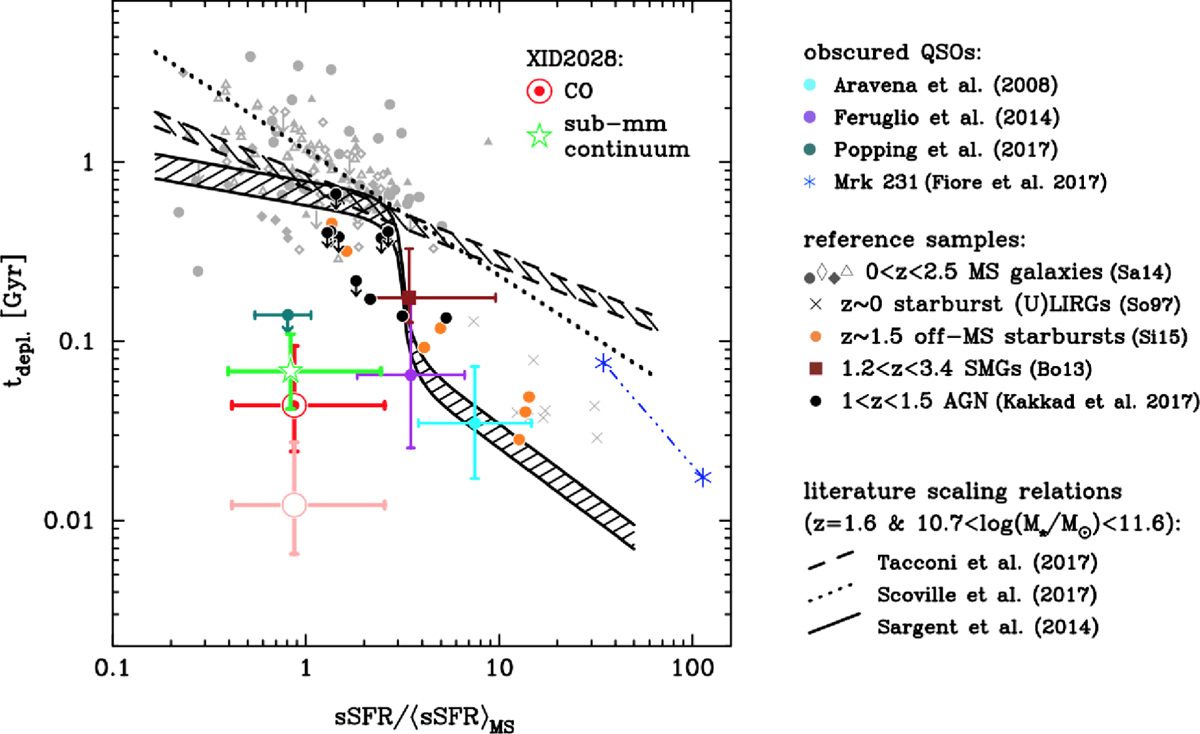
Depletion timescale (Mgas/SFR) plotted vs. the sSFR excess with respect to MS galaxies for obscured QSOs (coloured points) and reference samples (MS galaxies, SMGs/SBs, and AGN), as labelled. For XID2028 we report two values relative to the gas mass measurement obtained from the CO (red) and the submm continuum (green). For clarity, the values for XID2028 in the x-axis are slightly offset. In addition, we also report the value of the depletion timescale obtained also taking gas consumption through the ejection by the AGN wind into account (pink point). The sSFR is normalised to the expected values for normal and SB galaxies predicted by the calibration presented in Sargent et al. (2014). The blacksolid, dashed, and dotted line/regions traces the expected variation of the depletion timescale with the normalised sSFR for a MS galaxy at the redshift of XID2028, which has stellar mass in the range 5 × 10¹⁰−5 × 10¹¹ M⊙ predicted by the calibration presented in Sargent et al. (2014), Tacconi et al. (2018), and Scoville et al. (2017), respectively. XID2028 shows significantly lower depletion timescalethan those expected for the properties of its host galaxy, lying a factor ~10 to ~20 below the black lines.
Current usage metrics show cumulative count of Article Views (full-text article views including HTML views, PDF and ePub downloads, according to the available data) and Abstracts Views on Vision4Press platform.
Data correspond to usage on the plateform after 2015. The current usage metrics is available 48-96 hours after online publication and is updated daily on week days.
Initial download of the metrics may take a while.