Fig. 6
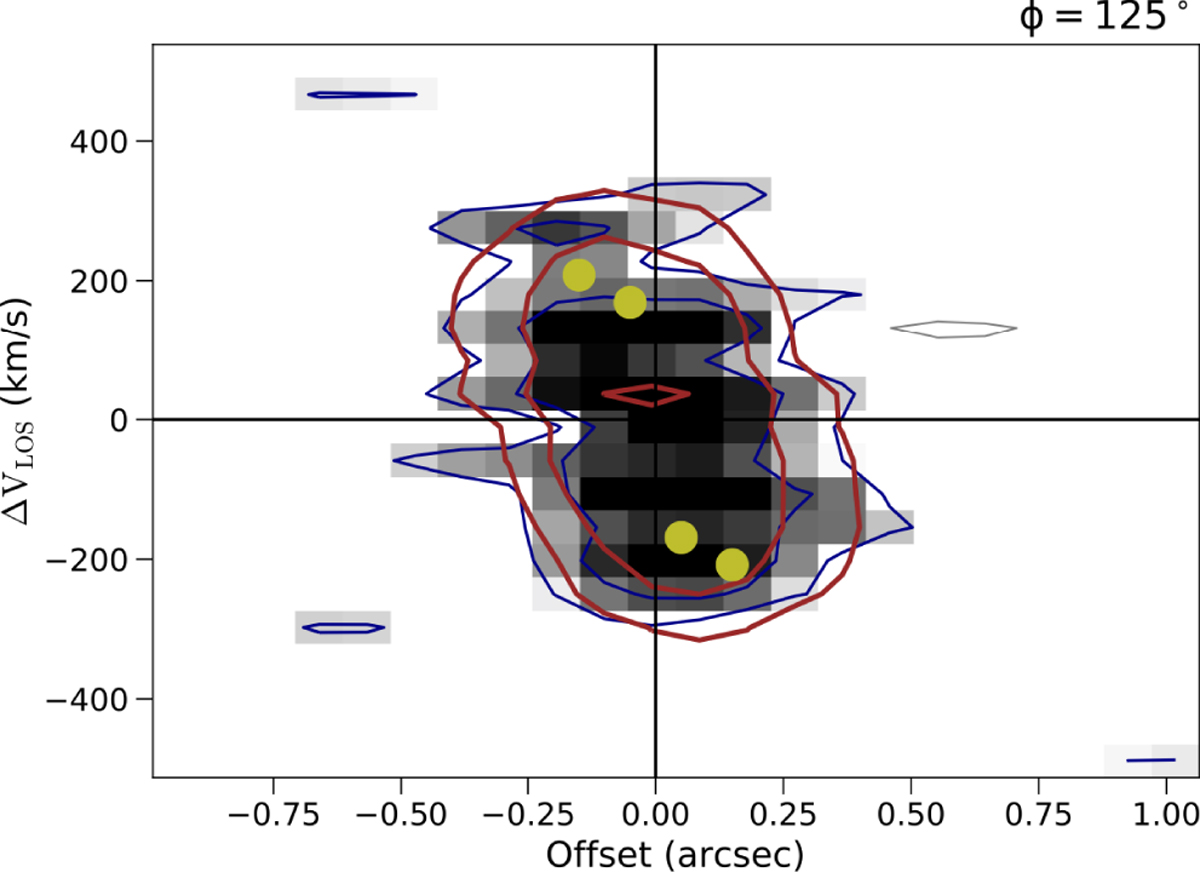
Position (i.e. offset along the major axis from the galaxy centre) vs. velocity diagram along the kinematic major axis of the molecular disc. The plotted velocity is along the line of sight (LOS). The blue and red contours show, respectively, the iso-density contours of the galaxy and the best-fit model found with 3DBAROLO, both starting from 2σ. The horizontal black solid line indicates the systemic velocity. The yellow circles denote the best-fit projected rotation velocity.
Current usage metrics show cumulative count of Article Views (full-text article views including HTML views, PDF and ePub downloads, according to the available data) and Abstracts Views on Vision4Press platform.
Data correspond to usage on the plateform after 2015. The current usage metrics is available 48-96 hours after online publication and is updated daily on week days.
Initial download of the metrics may take a while.