Fig. 5
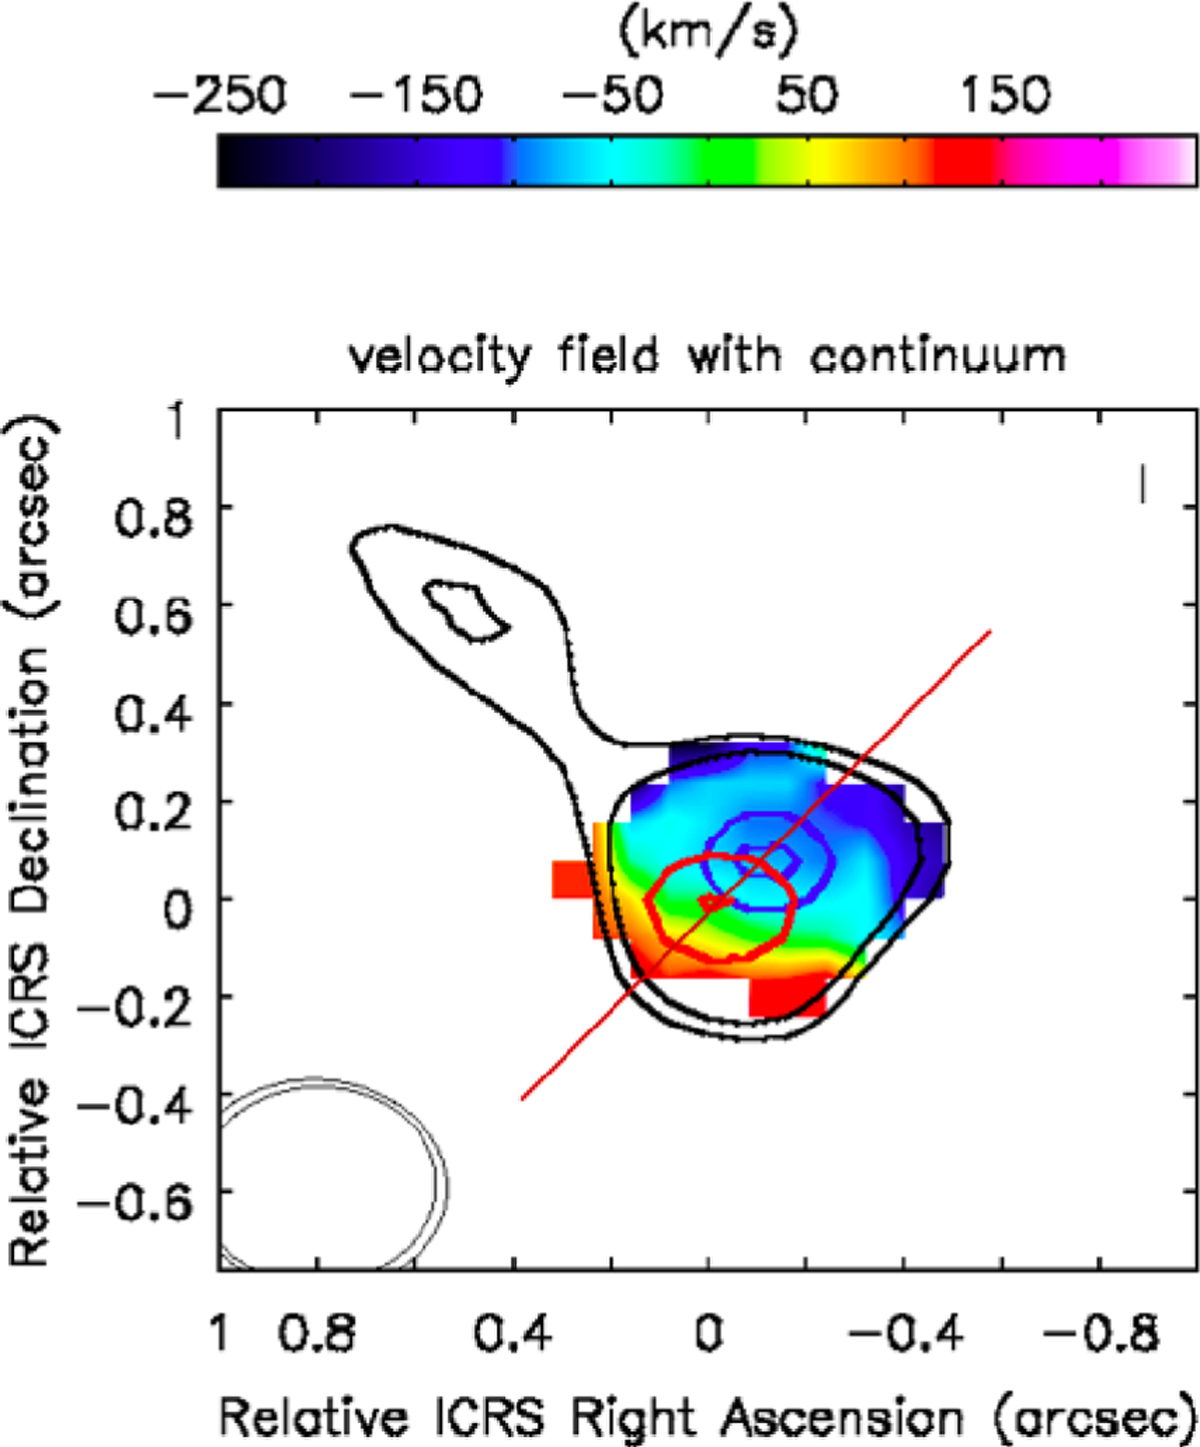
CO(5 − 4) velocity map with the continuum superimposed (black contours, referring to the 3 and 4σ contour from Fig. 1) and with the centroids of the flux maps obtained by integrating the channels in the red (0/300 km s−1) and blue (−300/0 km s−1) part of the core line profile (red and blue contours, respectively; the contours are drawn at 5, 6σ and 8, 9σ, respectively). The observed shift of the centroids is ~0.1″. The red line shows the direction of the major axis of the rotating disc.
Current usage metrics show cumulative count of Article Views (full-text article views including HTML views, PDF and ePub downloads, according to the available data) and Abstracts Views on Vision4Press platform.
Data correspond to usage on the plateform after 2015. The current usage metrics is available 48-96 hours after online publication and is updated daily on week days.
Initial download of the metrics may take a while.