Fig. 4
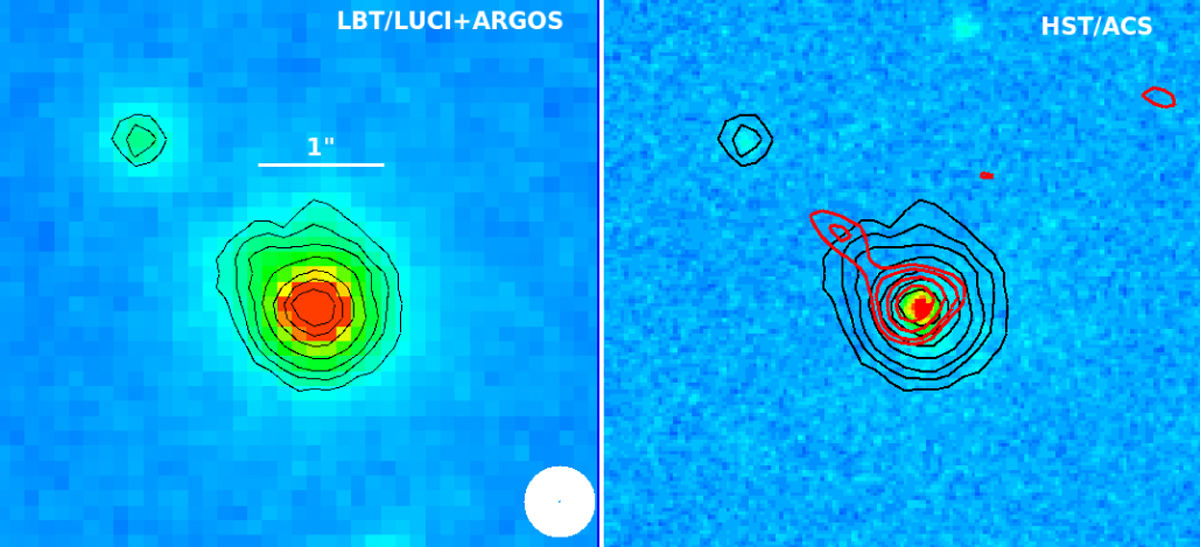
LUCI+ARGOS image (K band; left) and HST image (Advanced Camera for Survey F814W filter; right, taken from Brusa et al. 2015a,b) of a region of ~6.5 × 6.5″ around XID2028 (~ 55 × 55 kpc). In both panels, we show the contours from the LUCI+ARGOS data (black, arbitrary levels chosen to trace the whole K-band emission). The FWHM of the LUCI+ARGOS data is ~0.27″ and shown in the lower right corner of the left panel. The emission from the host galaxy is clearly resolved. In the right panel, we also plot the contours of the ALMA continuum at 1.3 mm (rest-frame 500 μm; red solid curves, from the right panel of Fig. 1). North is up and east is left.
Current usage metrics show cumulative count of Article Views (full-text article views including HTML views, PDF and ePub downloads, according to the available data) and Abstracts Views on Vision4Press platform.
Data correspond to usage on the plateform after 2015. The current usage metrics is available 48-96 hours after online publication and is updated daily on week days.
Initial download of the metrics may take a while.