Fig. 2
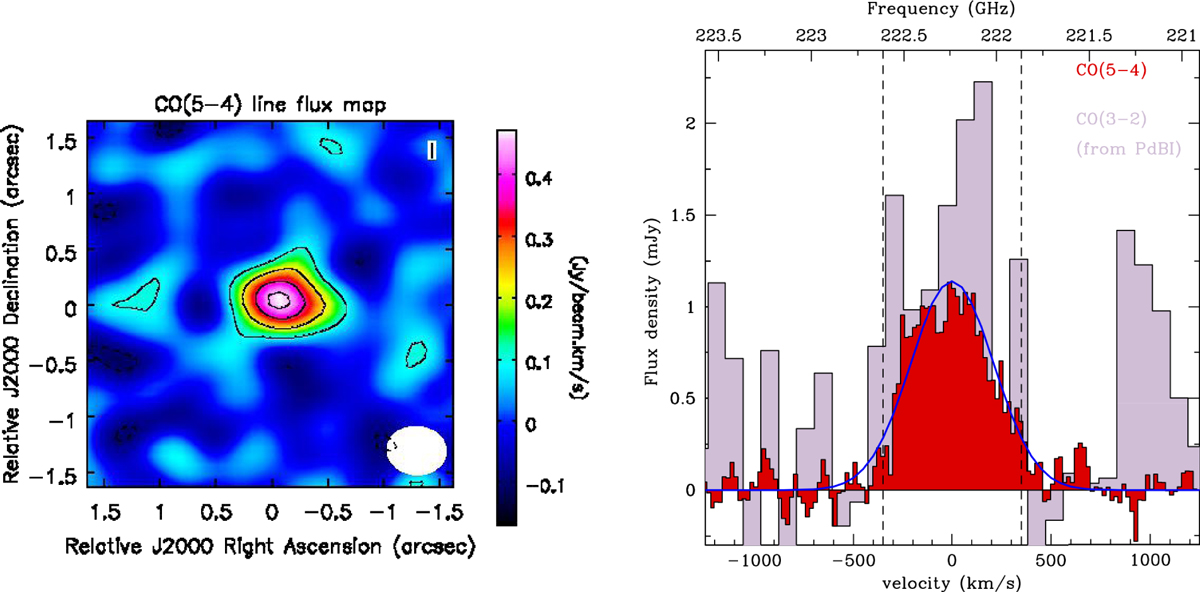
Left panel: CO(5 − 4) line image integrating the emisson from −800 to 800 km s−1 (see Sect. 2.2), imaged with the Briggs weighting scheme. Contours are drawn at −3 (dashed), 3, 6, 10, and 14σ (solid; σ = 0.032 Jy beam−1 km s−1). The ellipse in the lower right corner denotes the beam size (0.54” × 0.43”). The FoV is about 3″× 3″ (~ 25 ×25 kpc; 1" corresponds to 8.5 kpc at the redshift of the source). The detected CO(5 − 4) emission is confined to the central ~4 × 4 kpc. Right panel: continuum-subtracted ALMA spectrum extracted around the CO(5 − 4) transition, rebinned at 20 km s−1 per channel. The red filled histogram shows the spectrum extracted from a polygonal aperture encompassing the 3σ contours of the line emission shown in the left panel (roughly corresponding to the 1″ X-shooter slit width; Perna et al. 2015). The dashed lines at −350 and 350 km s−1 are used to define the blue and red tails of the CO emission (see Sect. 6). The purple histogram reproduces the CO(3 − 2) emission from PdBI, taken from Brusa et al. (2015b). The blue line shows the fit with a single Gaussian with FWHM = 550 km s−1.
Current usage metrics show cumulative count of Article Views (full-text article views including HTML views, PDF and ePub downloads, according to the available data) and Abstracts Views on Vision4Press platform.
Data correspond to usage on the plateform after 2015. The current usage metrics is available 48-96 hours after online publication and is updated daily on week days.
Initial download of the metrics may take a while.