Fig. A.1
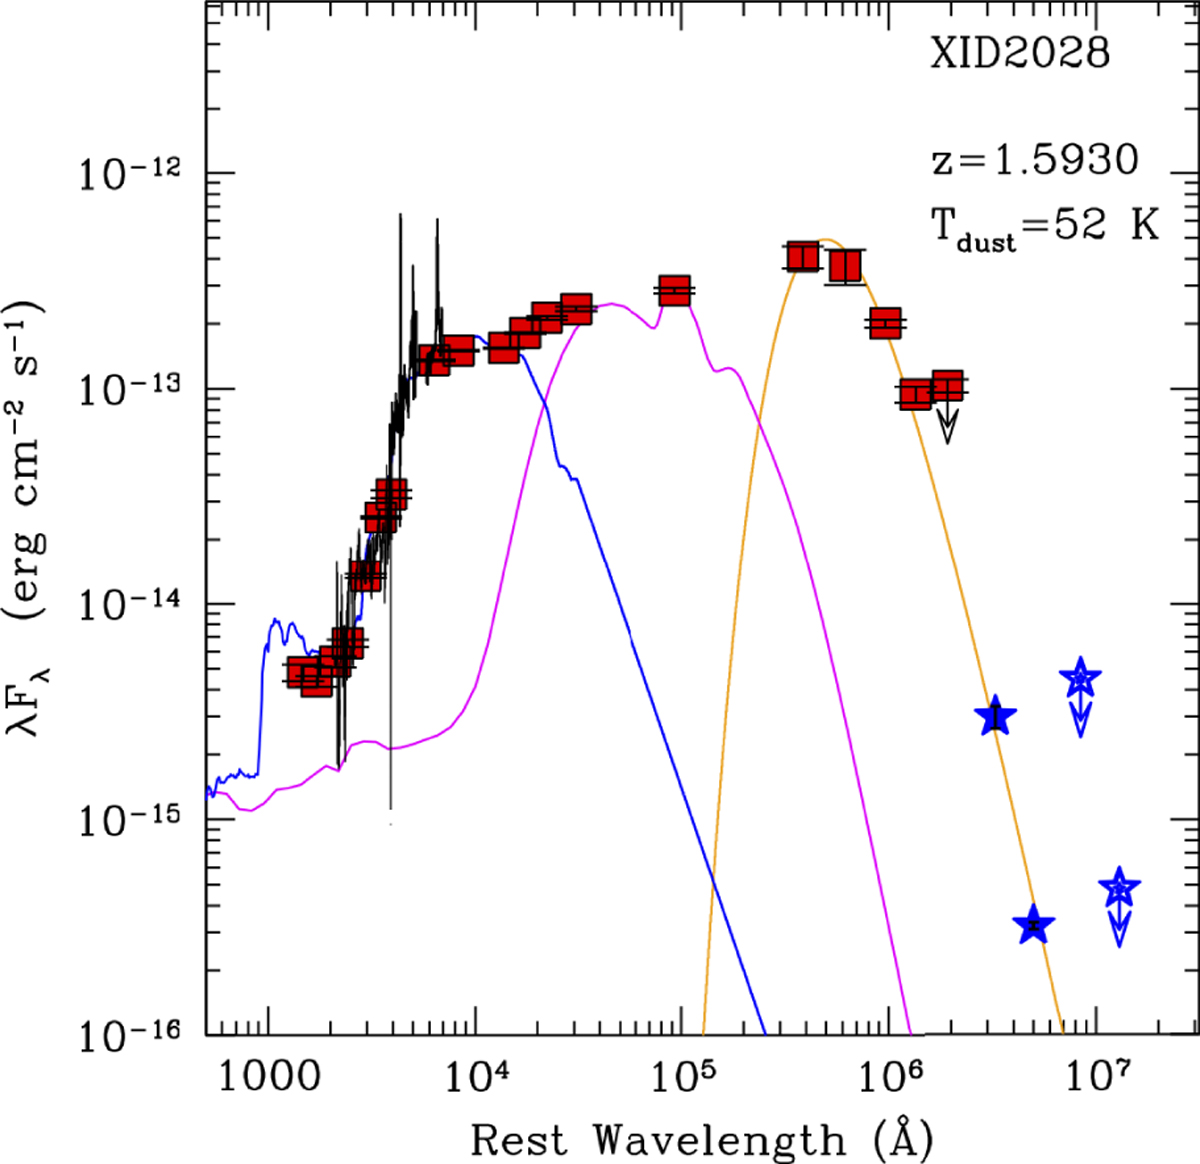
Spectral energy distribution of XID2028, shown in the rest frame. Red squares indicate the observed photometry, in the UV-optical-NIR-MIR-FIR regime, extracted from the Laigle et al. (2016) catalogue. The blue stars indicate the ALMA bands 7 and 6 data points and 2 mm and 3 mm upper limits from PdBI and ALMA Band 3. In the rest-frame optical range we also over plot the X-shooter spectrum (from Perna et al. 2015). The blue, magenta, and orange curves correspond to the stellar, AGN, and grey-body components found as a best-fit solution of the overall photometry.
Current usage metrics show cumulative count of Article Views (full-text article views including HTML views, PDF and ePub downloads, according to the available data) and Abstracts Views on Vision4Press platform.
Data correspond to usage on the plateform after 2015. The current usage metrics is available 48-96 hours after online publication and is updated daily on week days.
Initial download of the metrics may take a while.