Fig. 10
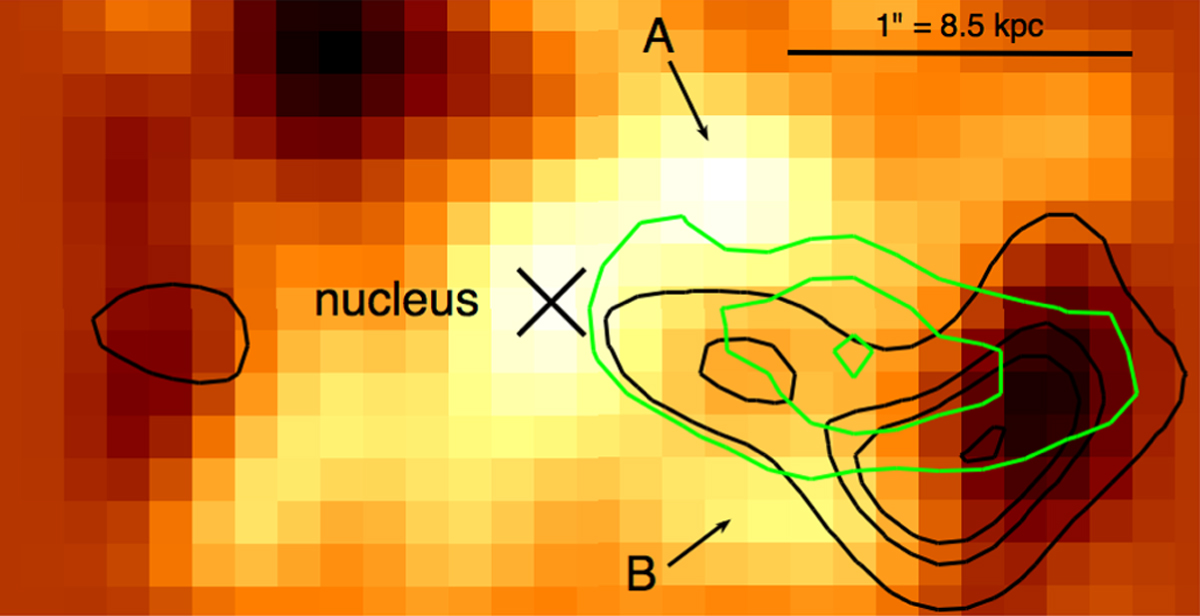
Narrow Hα map (from Cresci et al. 2015a) with the contours of the molecular outflow (black; from the left panel of Fig. 9) and the contours of the ionised outflow superimposed (green; from Cresci et al. 2015a). ALMA contours are drawn at 1, 2, 2.5, and 3σ. The cross indicates the QSO nucleus position. We also label with A and B the two star forming clumps reported in Cresci et al. (2015a). See text for details.
Current usage metrics show cumulative count of Article Views (full-text article views including HTML views, PDF and ePub downloads, according to the available data) and Abstracts Views on Vision4Press platform.
Data correspond to usage on the plateform after 2015. The current usage metrics is available 48-96 hours after online publication and is updated daily on week days.
Initial download of the metrics may take a while.