Fig. 1
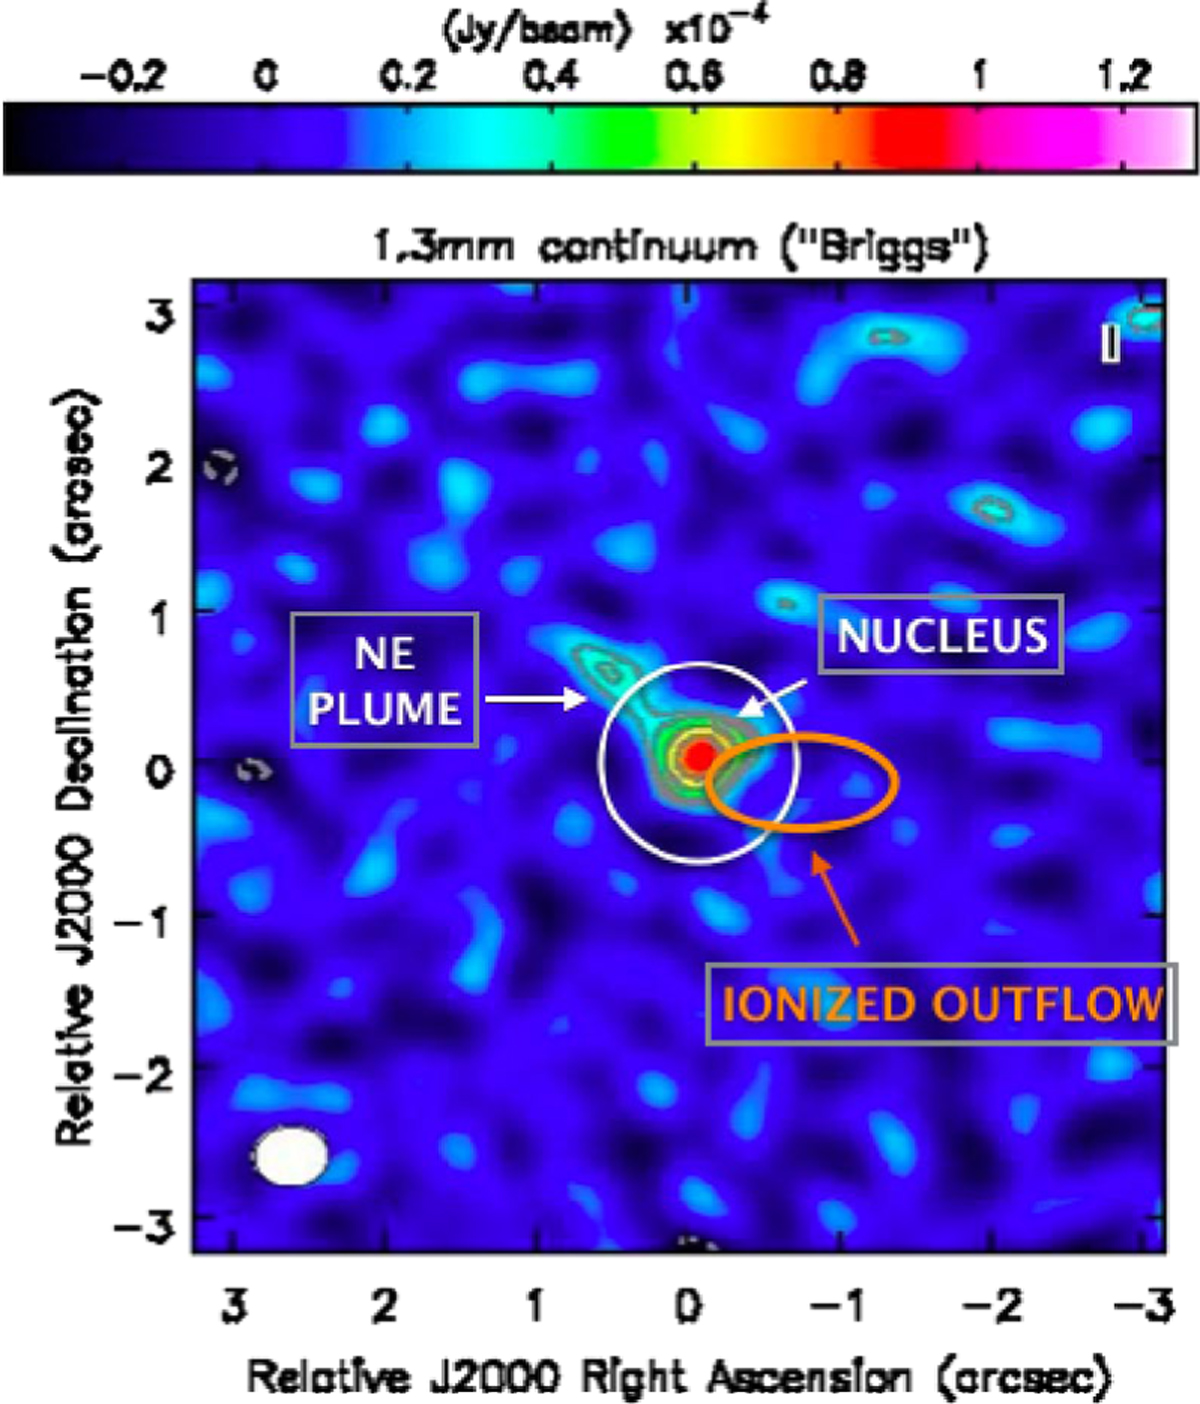
1.3 mm (Band 6) continuum image of XID2028 obtained with Briggs weighting. Dashed contours are drawn at negative 2σ fluctuations.Solid contours are drawn at 3, 4, 6, and 8σ with respect to the image rms (with this weighting scheme, rms = 9.6 μJy beam−1). The large FoV is shown to highlight the significance of the continuum detection. The two components detected in the continuum (“nucleus” and “plume”) are labelled in the image. The (white) circle represents a reference region of 1″ diameter centred on the continuum peak emission. The orange ellipse denotes the position of the ionised outflow reported in Cresci et al. (2015a; see also Sect. 6). North is up and east is left.
Current usage metrics show cumulative count of Article Views (full-text article views including HTML views, PDF and ePub downloads, according to the available data) and Abstracts Views on Vision4Press platform.
Data correspond to usage on the plateform after 2015. The current usage metrics is available 48-96 hours after online publication and is updated daily on week days.
Initial download of the metrics may take a while.