Fig. 7
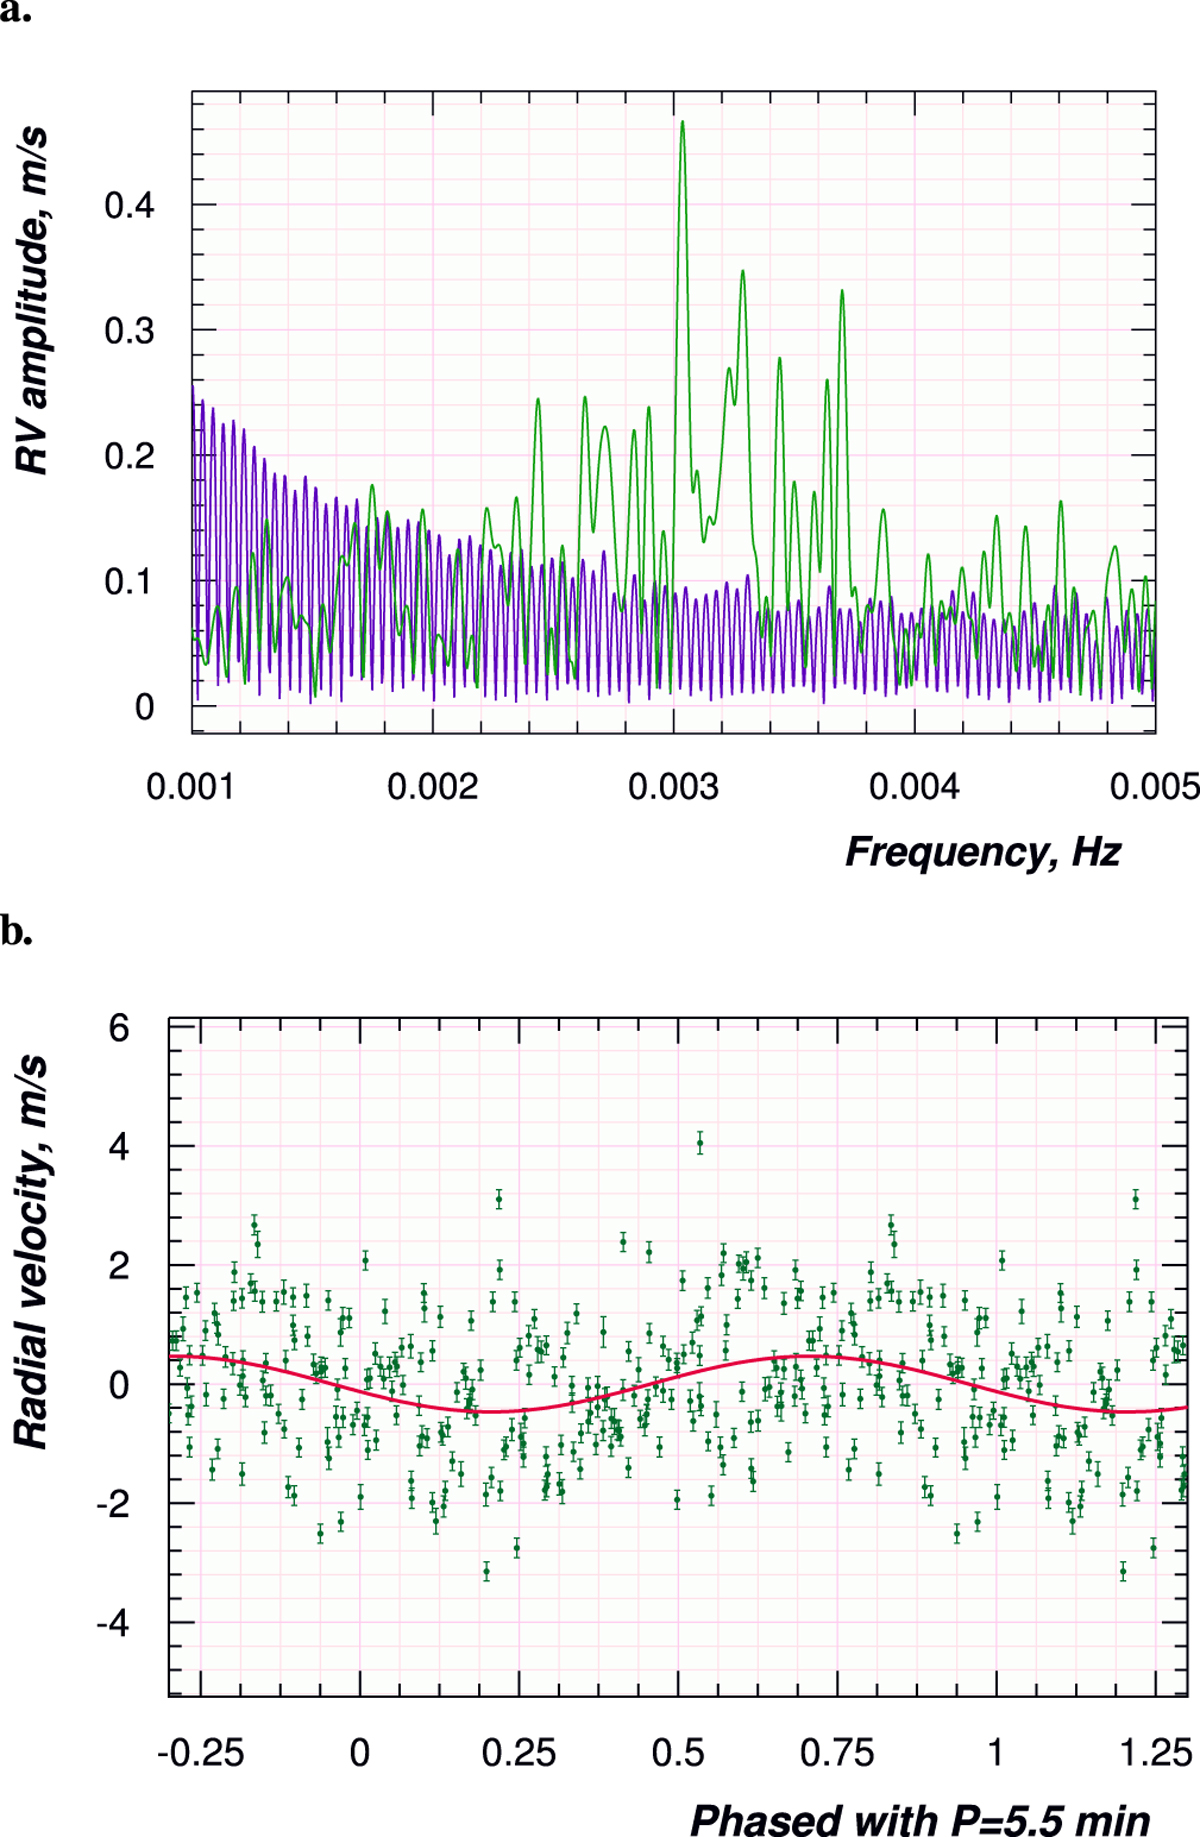
Detection of solar p-mode oscillations with Sun-as-a-star PEPSI spectra. Panel a: Frequency fits from the time series of 8.5 hours on Oct. 15, 2016. The peak at 3 mHz (5.5 min) appears with an amplitude of 47 cm s−1 (the blue line is the window function). Panel b: RV vs phase combined with the best-fit period. Its rms is 1.2 m s−1 .
Current usage metrics show cumulative count of Article Views (full-text article views including HTML views, PDF and ePub downloads, according to the available data) and Abstracts Views on Vision4Press platform.
Data correspond to usage on the plateform after 2015. The current usage metrics is available 48-96 hours after online publication and is updated daily on week days.
Initial download of the metrics may take a while.