Fig. 6
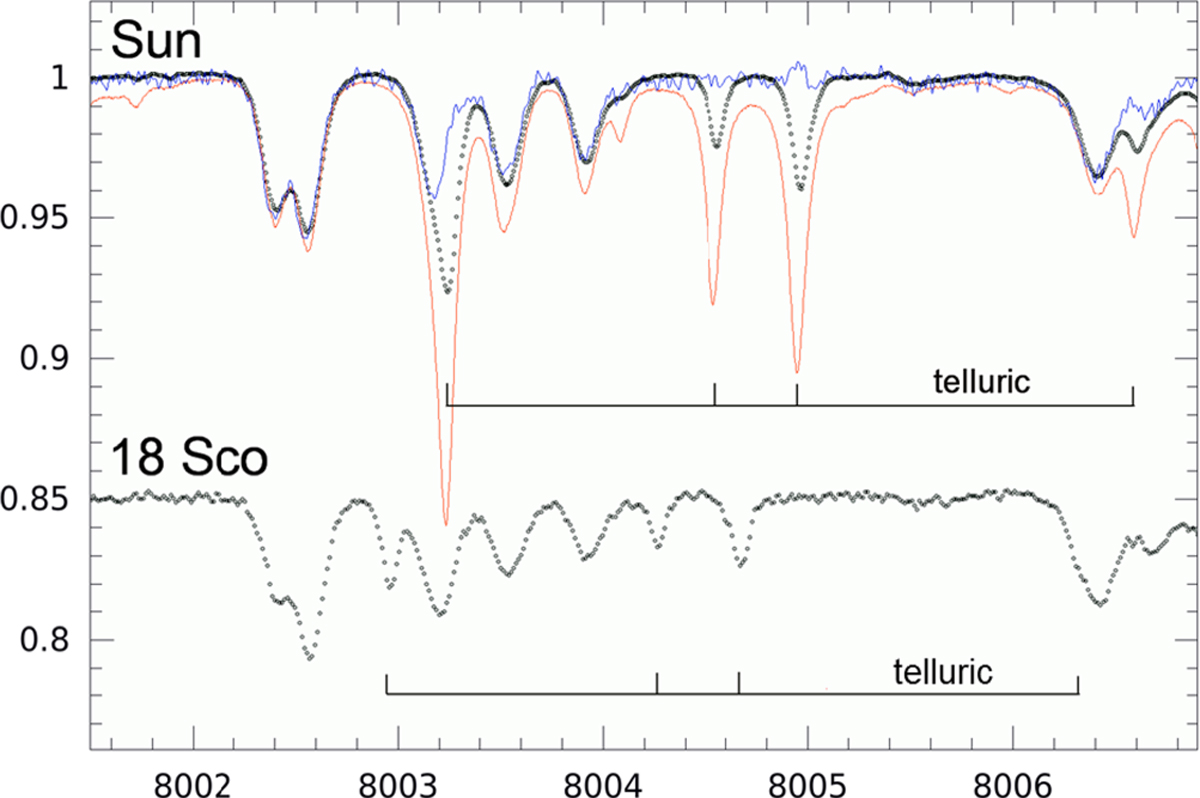
Terrestrial water-vapor lines in the CN-line region near 8000 Å for the Sun (top) and the solar-twin 18 Sco (bottom; shifted by –0.15). The PEPSI spectra are shown as dots. The solar spectrum is compared with the IAG FTS atlas (the deep-lined spectrum in red) and the “dry” NSO FTS atlas (weaker lined in blue). The IAG FTS spectrum is contaminated by very strong telluric lines while the NSO spectrum is comparably more noisier. Note that the 18 Sco spectrum was shifted to match the solar spectrum.
Current usage metrics show cumulative count of Article Views (full-text article views including HTML views, PDF and ePub downloads, according to the available data) and Abstracts Views on Vision4Press platform.
Data correspond to usage on the plateform after 2015. The current usage metrics is available 48-96 hours after online publication and is updated daily on week days.
Initial download of the metrics may take a while.