Fig. 4
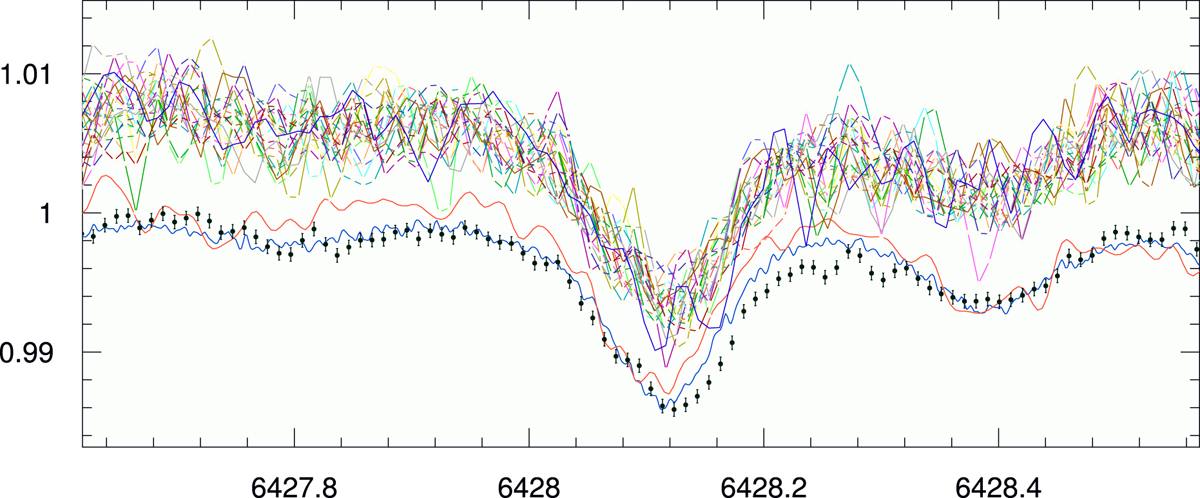
Deep PEPSI spectrum (dots with error bars) and its individual 20 exposures (lines) for a 1-Å wavelength region around the Cr I 6428.1-Å line. The twenty individual back-to-back spectra are offset in continuum by +0.01 for better visibility. The deep spectrum is unshifted and directly compared with the IAG (blue line) and NSO (red line) FTS atlases. We note that the equivalent width of the Cr line at 6428.1 Å is just 1.8 mÅ.
Current usage metrics show cumulative count of Article Views (full-text article views including HTML views, PDF and ePub downloads, according to the available data) and Abstracts Views on Vision4Press platform.
Data correspond to usage on the plateform after 2015. The current usage metrics is available 48-96 hours after online publication and is updated daily on week days.
Initial download of the metrics may take a while.