Fig. 3
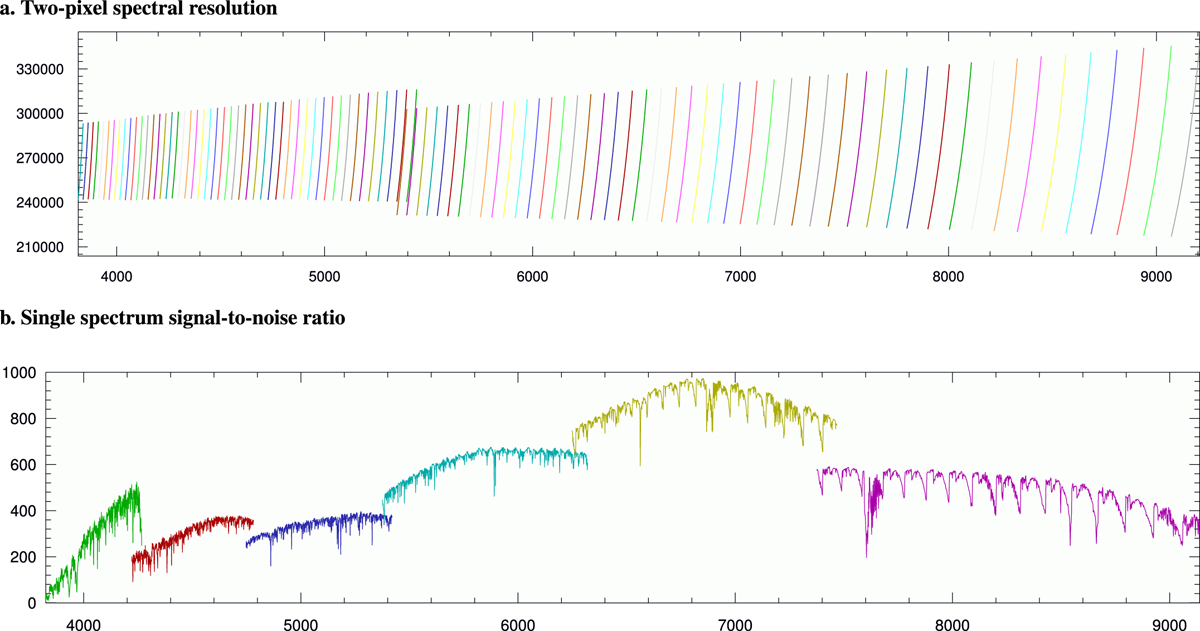
PEPSI deep spectra characteristics. Panel a: two-pixel spectrograph resolution as a function of wavelength. Shown is the free spectral range per échelle order. Panel b: S/N for an example spectrum. The spectra from the individual CD are identified with different colors and are, from left to right, CD I to CD VI. Quasiperiodic peaks indicate the échelle orders.
Current usage metrics show cumulative count of Article Views (full-text article views including HTML views, PDF and ePub downloads, according to the available data) and Abstracts Views on Vision4Press platform.
Data correspond to usage on the plateform after 2015. The current usage metrics is available 48-96 hours after online publication and is updated daily on week days.
Initial download of the metrics may take a while.