Fig. 2
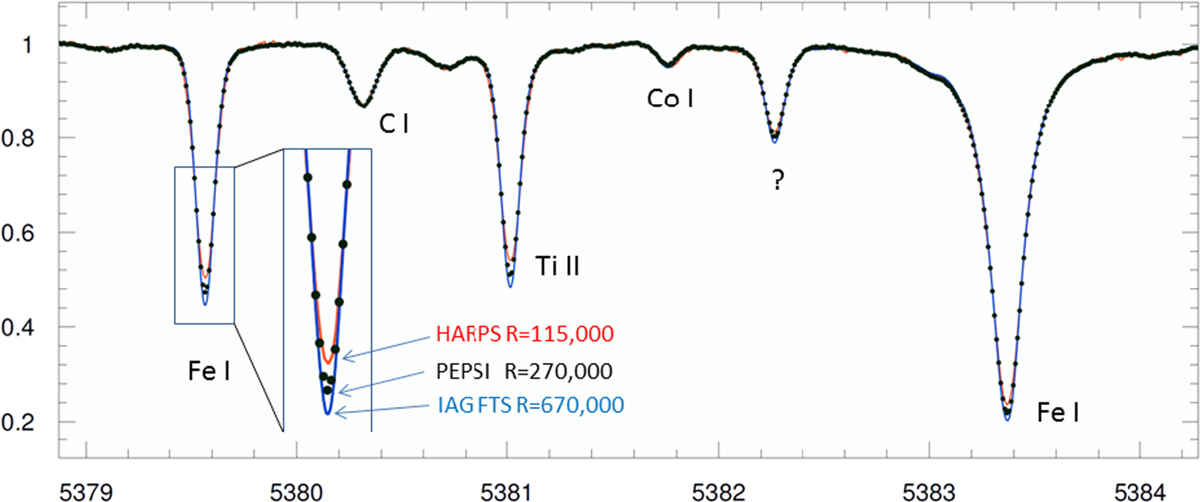
Wavelength region around the solar C I line at 5380.3 Å. Dots indicate one of the PEPSI deep spectra and the dark blue and bright red line is the IAG FTS atlas from Reiners et al. (2016) and the HARPS spectrum from Molaro et al. (2013), respectively. The zoom shows the Fe I 5379.6-Å line. The FTS atlas has a spectral resolution of ≈670 000, the HARPS spectrum 115 000.
Current usage metrics show cumulative count of Article Views (full-text article views including HTML views, PDF and ePub downloads, according to the available data) and Abstracts Views on Vision4Press platform.
Data correspond to usage on the plateform after 2015. The current usage metrics is available 48-96 hours after online publication and is updated daily on week days.
Initial download of the metrics may take a while.