Fig. 3
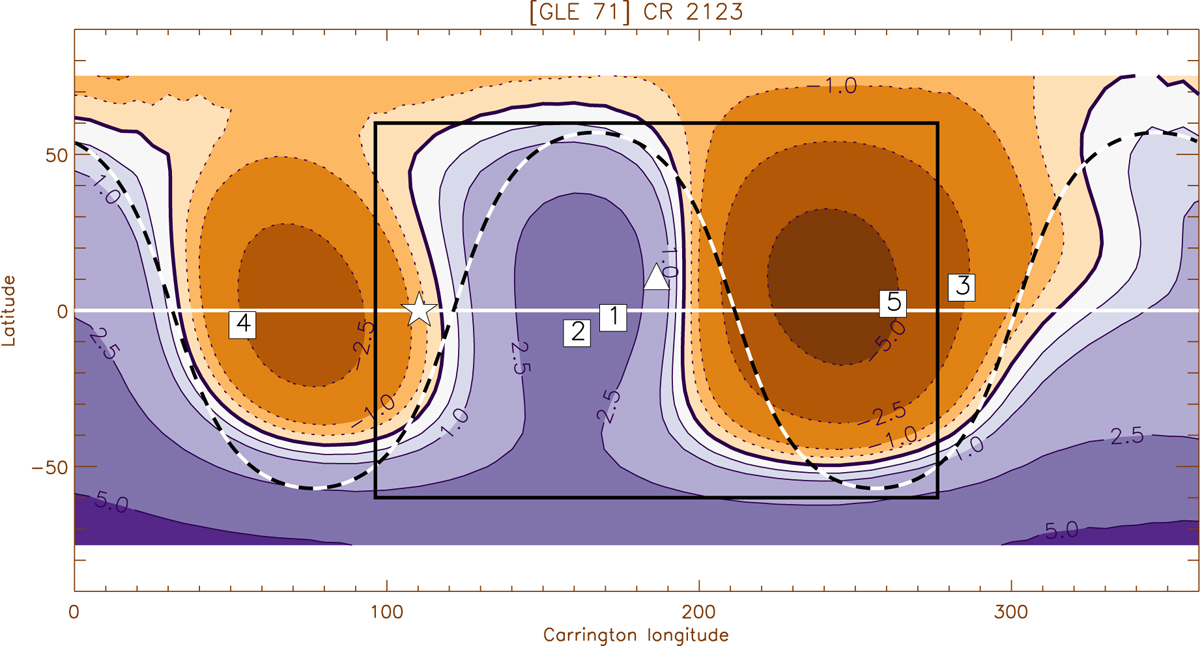
Synoptic source surface map computed for r = 2.5 R⊙ using photospheric measurements for Carrington rotation 2123. The location of the flare on May 17th, 2012, is indicated with a triangle. The central meridian at the time of the flare is indicated with a star. The Parker spiral connecting footpoints for each observer, assuming a solar wind speed of 400 km s−1, are shown with squares, numbered as 1: Earth, 2: MSL, 3: STA, 4: STB, 5: MES. Purple regions indicate outward-pointing magnetic fields, orange regions inward-pointing magnetic fields, and the boundary line is shown as a solid black curve. The heliographic equatorial plane is shown as a solid white line. Contour values are given in microtesla. A fit for a simple wavy current sheet is shown as a black dashed curve, and the boundary of the injection region used in particle transport simulations is shown with a black rectangle. Potential field data is provided by the Wilcox Solar Observatory.
Current usage metrics show cumulative count of Article Views (full-text article views including HTML views, PDF and ePub downloads, according to the available data) and Abstracts Views on Vision4Press platform.
Data correspond to usage on the plateform after 2015. The current usage metrics is available 48-96 hours after online publication and is updated daily on week days.
Initial download of the metrics may take a while.