Fig. 8
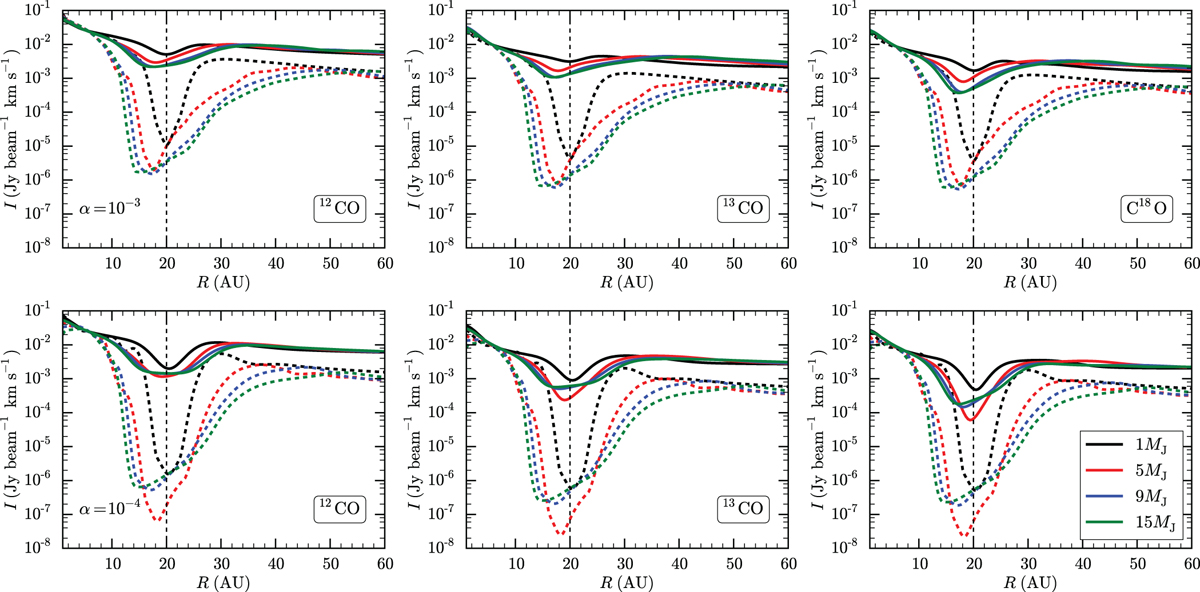
Radial intensity profiles of J = 3-2 CO isotopolog emission lines (solid lines). In the top and bottom panels, α = 10−3 and 10−4, respectively. From left to right: 12CO, 13 CO, C18 O. The emission was convolved with a 0.03′′ resolution beam for disks located at a distance of 150 pc. The dashed lines show the gas surface densities from the hydrodynamical simulations normalized at the emission at ~5 AU. The vertical dashed line indicates the radial location of the planet.
Current usage metrics show cumulative count of Article Views (full-text article views including HTML views, PDF and ePub downloads, according to the available data) and Abstracts Views on Vision4Press platform.
Data correspond to usage on the plateform after 2015. The current usage metrics is available 48-96 hours after online publication and is updated daily on week days.
Initial download of the metrics may take a while.