Free Access
Fig. 5
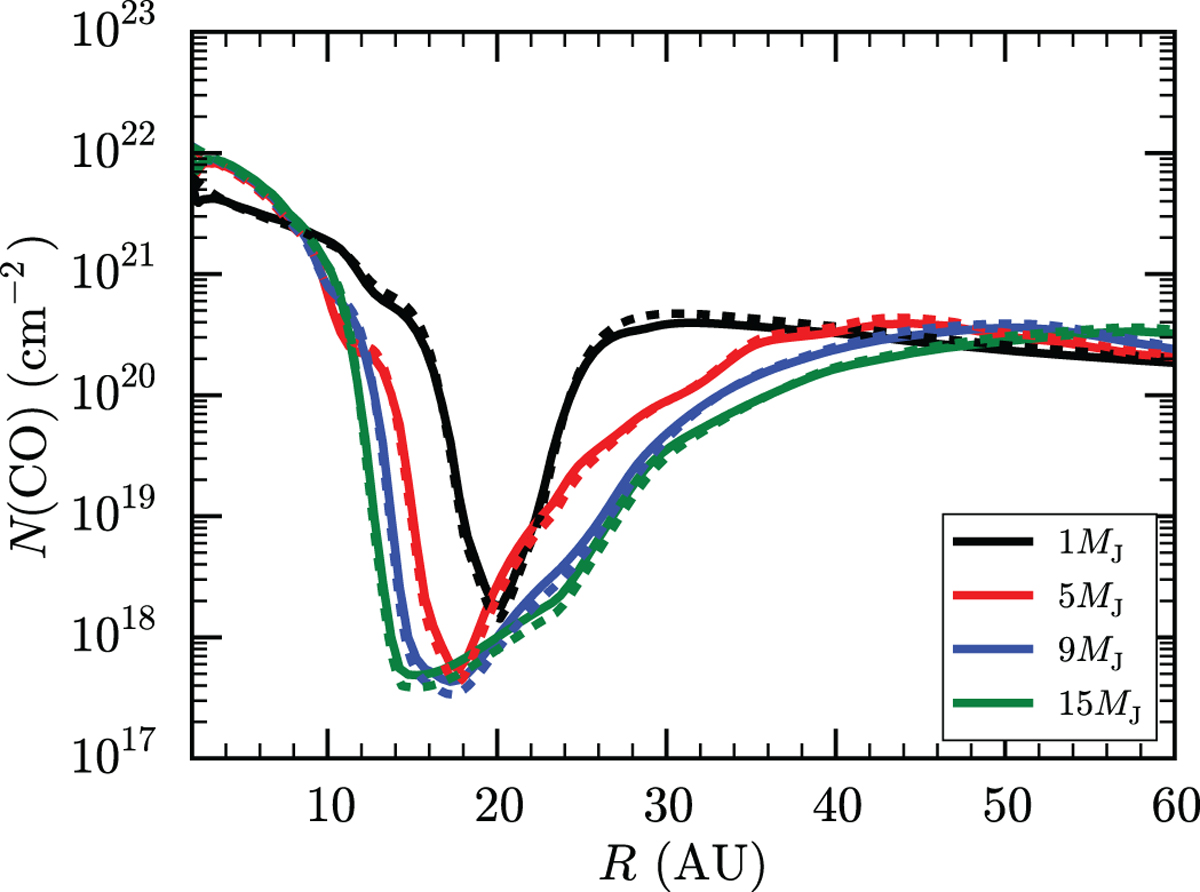
Solid lines: CO column densities for α = 10−3 cases. The dashed lines indicate total gas surface densities normalized to the CO column densities at 5 AU, where the normalization factor is on the order of the total carbon abundance assumed in the models.
Current usage metrics show cumulative count of Article Views (full-text article views including HTML views, PDF and ePub downloads, according to the available data) and Abstracts Views on Vision4Press platform.
Data correspond to usage on the plateform after 2015. The current usage metrics is available 48-96 hours after online publication and is updated daily on week days.
Initial download of the metrics may take a while.