Fig. 4
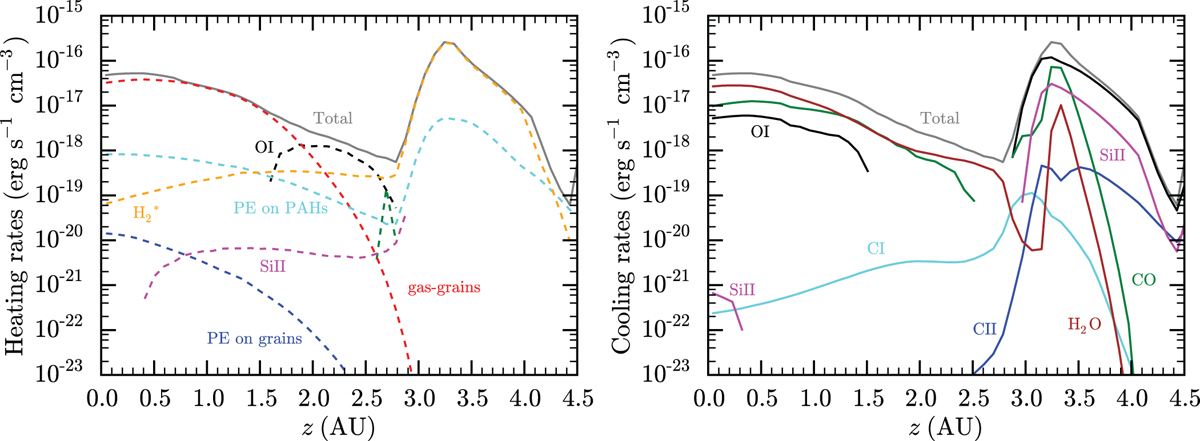
Vertical cut of the main heating and cooling rates within the gap, at 20 AU, for the α= 10−3, Mp = 15 MJ model. Heating rates are shown with dashed lines; cooling rates are indicated with solid lines. Molecules and atoms contributingto both heating and cooling share the same color in both panels. The gray solid line shows the total cooling rate, which equals the total heating rate. Different colors indicate different contributors. In the legend, “PE” stands for photoelectric effect.
Current usage metrics show cumulative count of Article Views (full-text article views including HTML views, PDF and ePub downloads, according to the available data) and Abstracts Views on Vision4Press platform.
Data correspond to usage on the plateform after 2015. The current usage metrics is available 48-96 hours after online publication and is updated daily on week days.
Initial download of the metrics may take a while.