Fig. 12
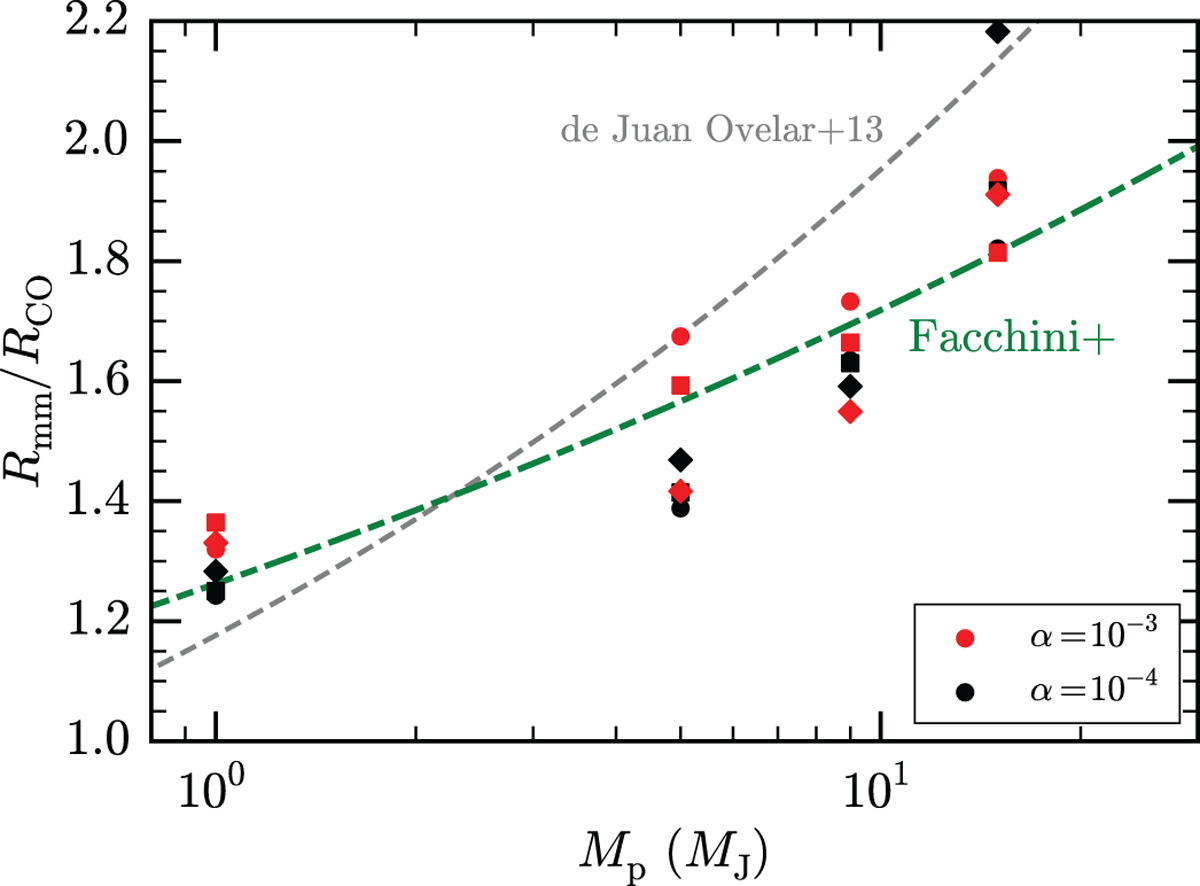
Ratio between the sub-mm ring Rmm and radius ofthe CO wall RCO. For this particular plot, the 13CO J = 3-2 line is used. As in Fig. 11, circles, squares, and diamonds indicate quantities retrieved from images convolved with a 0.03′′, 0.08′′, and 0.15′′ beam, respectively, for sources located at a distance of 150 pc. The dashed green line shows a linear fit obtained for this relation in log–log space. The gray dashed line indicates the fit by de Juan Ovelar et al. (2013) for the sub-mm radius/scattered light wall, obtained from a subsample of the same hydrodynamical simulations used in this paper.
Current usage metrics show cumulative count of Article Views (full-text article views including HTML views, PDF and ePub downloads, according to the available data) and Abstracts Views on Vision4Press platform.
Data correspond to usage on the plateform after 2015. The current usage metrics is available 48-96 hours after online publication and is updated daily on week days.
Initial download of the metrics may take a while.