Free Access
Fig. 10
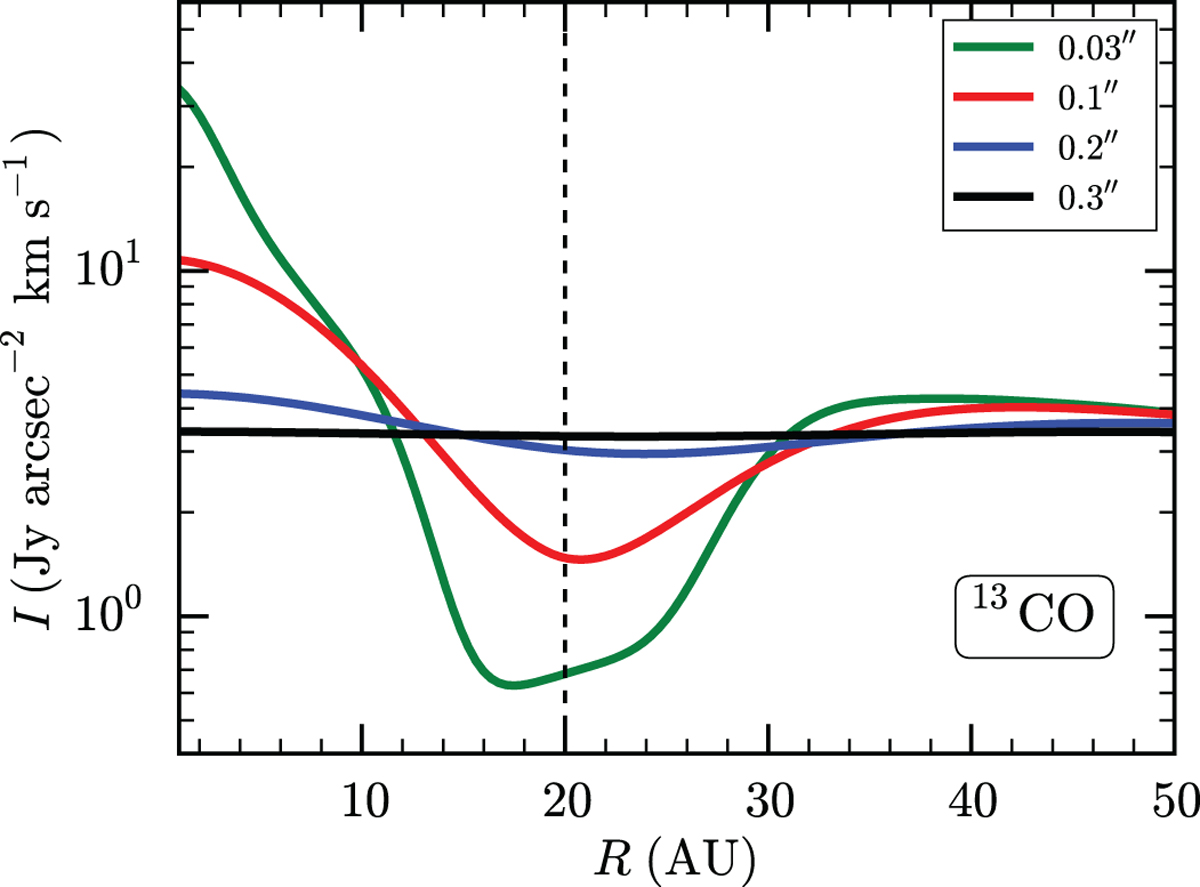
Radial intensity profile of the 13CO J = 3-2 line of the α = 10−4, Mp = 15 MJ simulation with different convolution beams. The source is located at 150 pc. The verticalblack dashed line indicates the radial location of the planet. Even at the lower resolution, the CO emission does not show a cavity, but clearly shows a gap.
Current usage metrics show cumulative count of Article Views (full-text article views including HTML views, PDF and ePub downloads, according to the available data) and Abstracts Views on Vision4Press platform.
Data correspond to usage on the plateform after 2015. The current usage metrics is available 48-96 hours after online publication and is updated daily on week days.
Initial download of the metrics may take a while.