Fig. 1
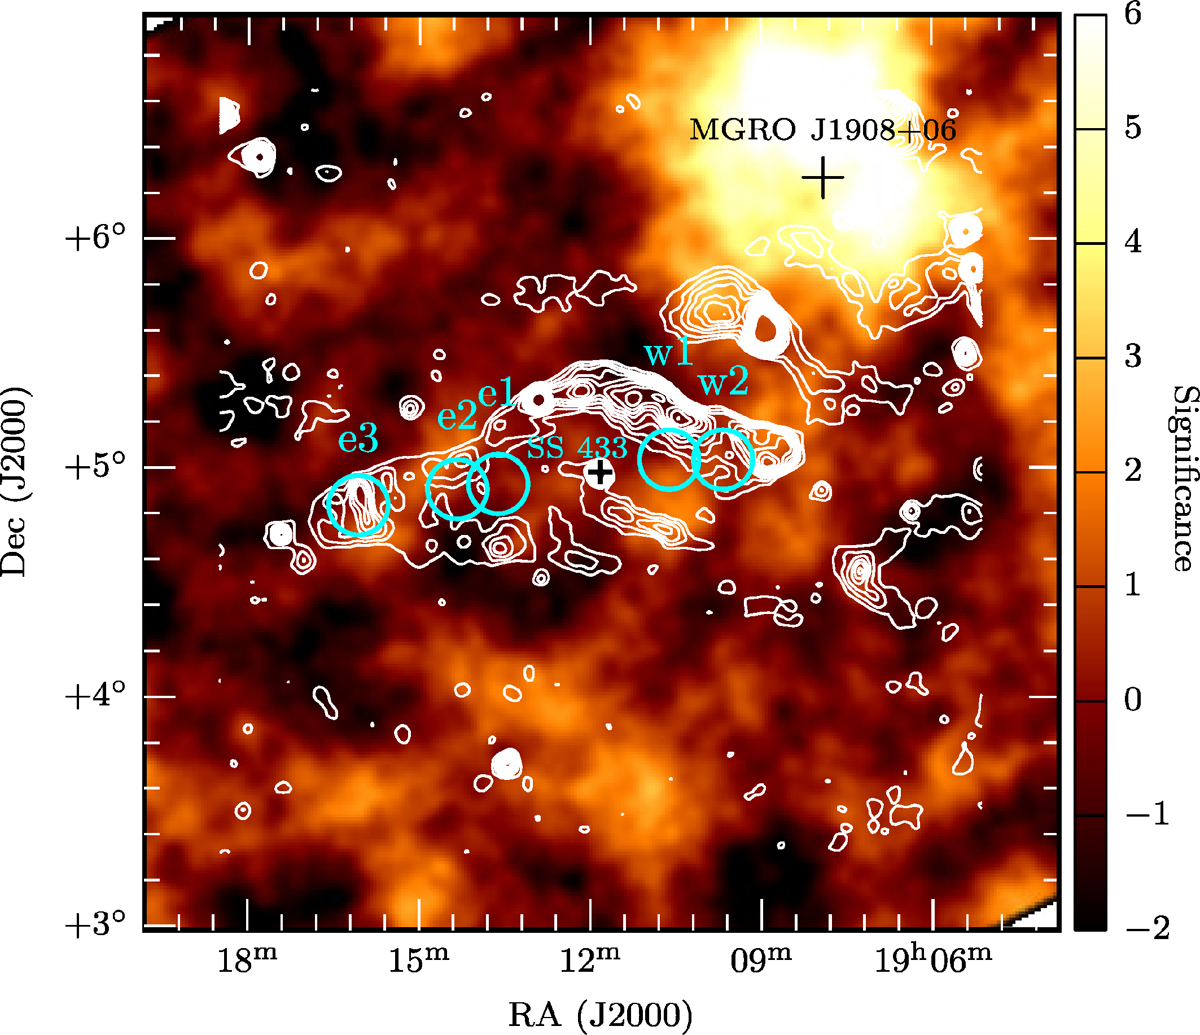
Significance map, derived from the H.E.S.S. data, for the FoV centred at the position of SS 433/W50 at E ≥ 287 GeV. GB6 4.85 GHz radio contours (white, from Gregory et al. 1996) are superimposed. Cyan circles indicate the positions of the interaction regions e1, e2, e3 (eastern “ear”) and w1, w2 (western “ear”). The bright source located north-west of SS 433 is MGRO J1908+06 (Abdo et al. 2007).
Current usage metrics show cumulative count of Article Views (full-text article views including HTML views, PDF and ePub downloads, according to the available data) and Abstracts Views on Vision4Press platform.
Data correspond to usage on the plateform after 2015. The current usage metrics is available 48-96 hours after online publication and is updated daily on week days.
Initial download of the metrics may take a while.