Fig. 3
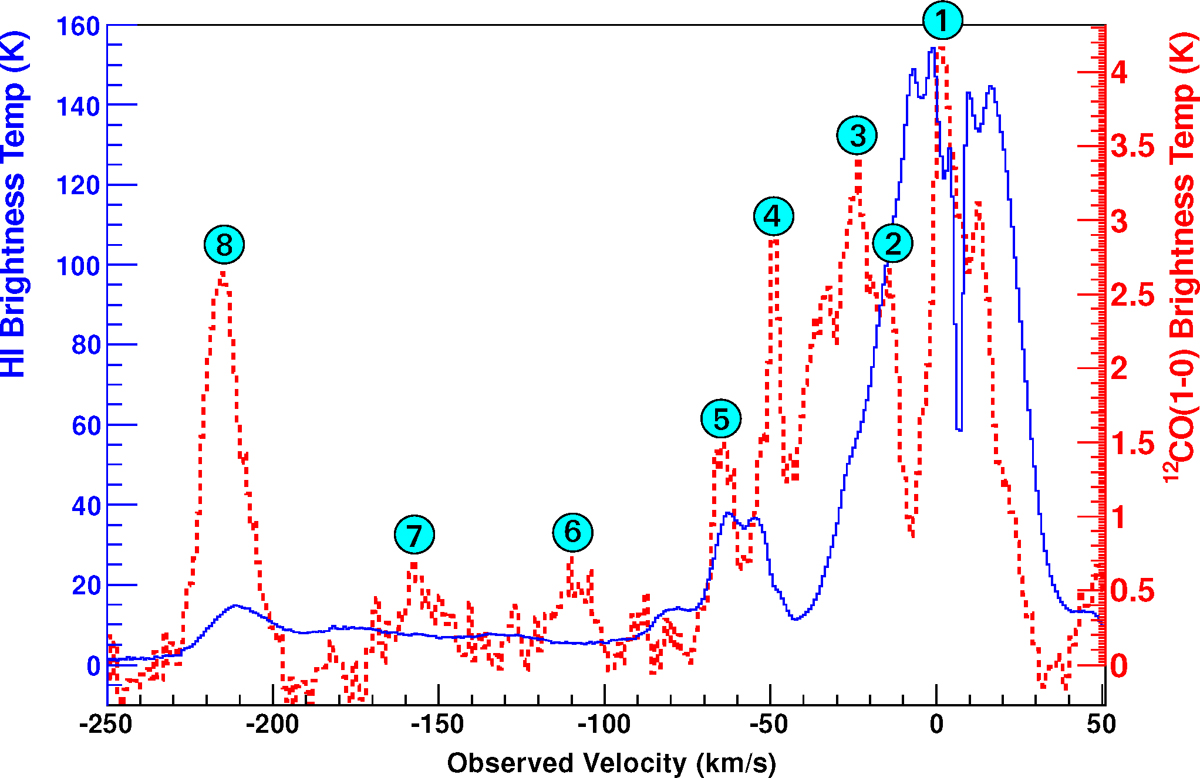
Brightness temperature distribution of molecular and atomic gas along the line-of-sight to HESS J1741−302. The red dashed line indicates 12CO data from the Nanten survey, while the blue line shows HI data from the SGPS. The profiles are extracted from the circular region with a radius of 0.1° centered on the HESS J1741−302 best fit position. The abscissa shows the observed velocity of gas in km s−1, while theordinate shows the brightness temperature (the left axis for HI and the right axis for 12CO) in K. Peaks in the 12CO brightness distribution are tagged with a number which indicates the corresponding interstellar cloud feature.
Current usage metrics show cumulative count of Article Views (full-text article views including HTML views, PDF and ePub downloads, according to the available data) and Abstracts Views on Vision4Press platform.
Data correspond to usage on the plateform after 2015. The current usage metrics is available 48-96 hours after online publication and is updated daily on week days.
Initial download of the metrics may take a while.