Fig. 2
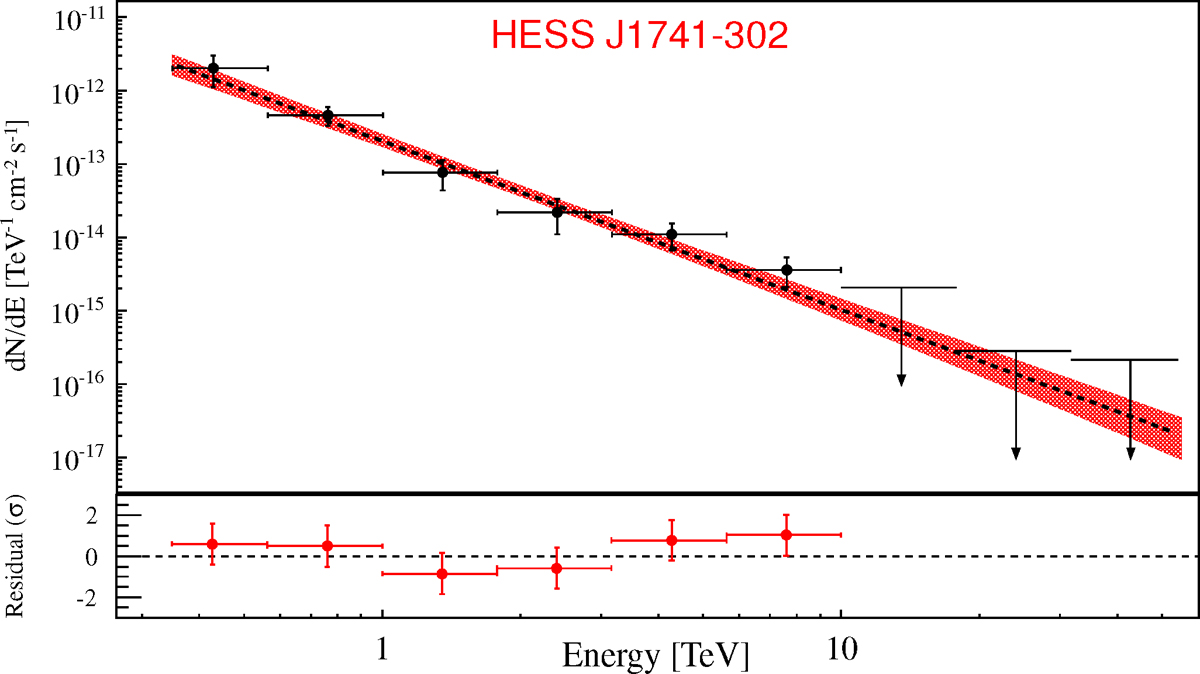
VHE γ-ray spectrum of HESS J1741−302 extracted from the source region shown in Fig. 1. The black dots show the flux points with 1σ errors, while the red shaded region represents the 68% confidence interval for the fitted spectral model (between 0.4 TeV and 56.2 TeV). The dashed black line shows the best fit power-law function. The differential flux upper limits are at the 99% confidence level and are shown with arrows. The spectrum shown is binned in such a way that all points have a minimum significance level of 2.0σ. The significance of the last point is 2.8σ.
Current usage metrics show cumulative count of Article Views (full-text article views including HTML views, PDF and ePub downloads, according to the available data) and Abstracts Views on Vision4Press platform.
Data correspond to usage on the plateform after 2015. The current usage metrics is available 48-96 hours after online publication and is updated daily on week days.
Initial download of the metrics may take a while.