Fig. 1
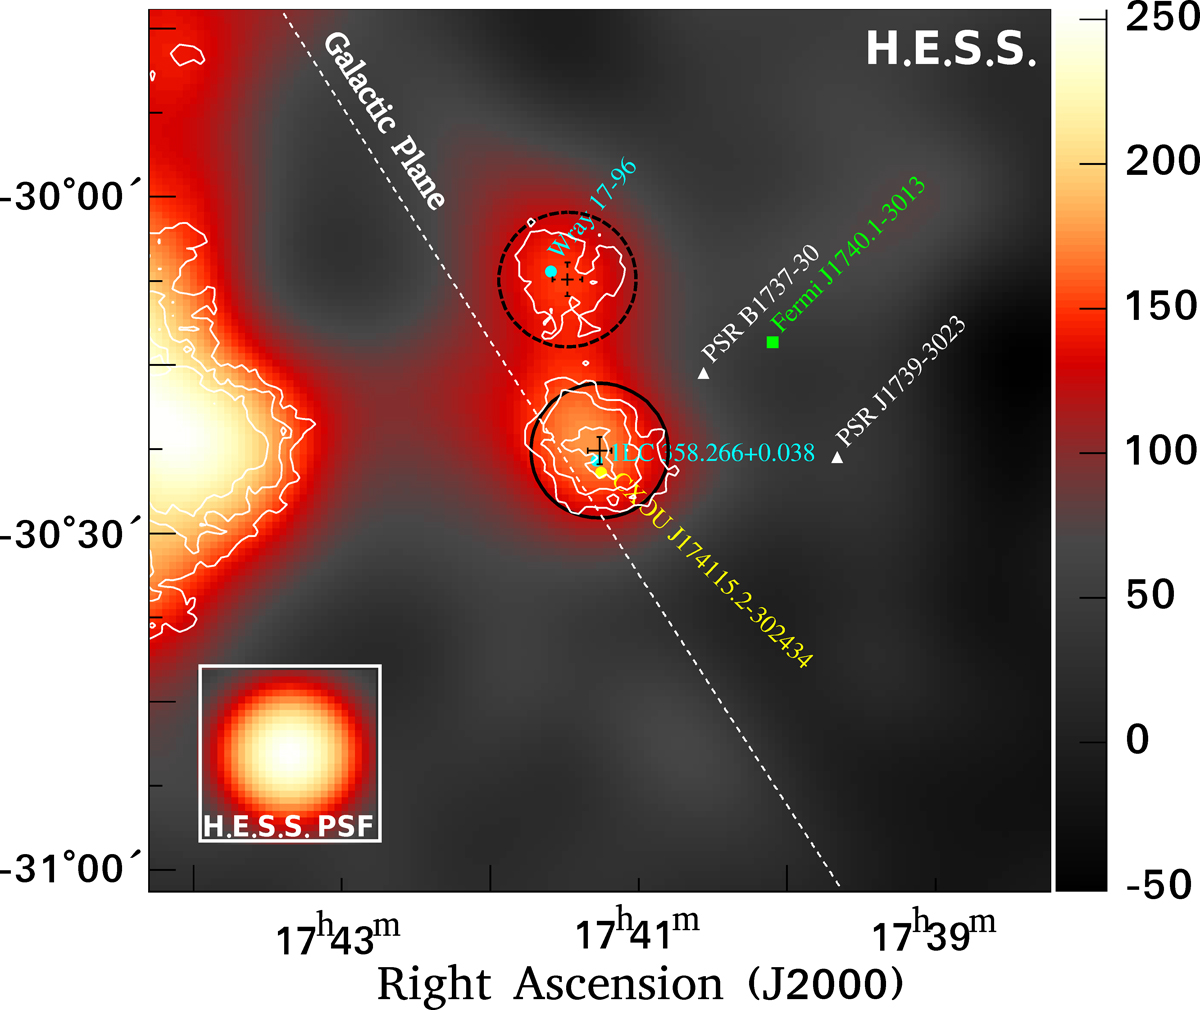
γ-ray excess map of the region around HESS J1741−302, smoothed with a Gaussian kernel of 0.08° width chosen to match the H.E.S.S. PSF which is shown inside the white box in the bottom left corner. The color scale is in units of excess γ-rays per smoothing Gaussian width. The black circle shows the source region used for extracting the spectrum, while the black cross indicates the value and 1σ error interval (including systematic uncertainties) of the best fit position of the source. Similarly, the dashed black circle shows the hotspot region, while the dashed black cross indicates the value and 1σ error interval of the best fit position of this emission. The pulsars listed in Table 1 are marked with white triangles. The light blue dots mark the position of the compact radio source 1LC 358.266+0.038 and the LBVstar Wray 17−96, while the green dot marks the best fit position of Fermi J1740.1−3013, respectively. The yellow circle show the location of the Chandra X-ray source CXOU J174115.2−302434. The white dashed line indicates the orientation of the Galactic plane, while the white contours show 5σ, 6σ and 7σ (pre-trial) statistical significance of the VHE γ-ray emission.
Current usage metrics show cumulative count of Article Views (full-text article views including HTML views, PDF and ePub downloads, according to the available data) and Abstracts Views on Vision4Press platform.
Data correspond to usage on the plateform after 2015. The current usage metrics is available 48-96 hours after online publication and is updated daily on week days.
Initial download of the metrics may take a while.