Fig. A.1
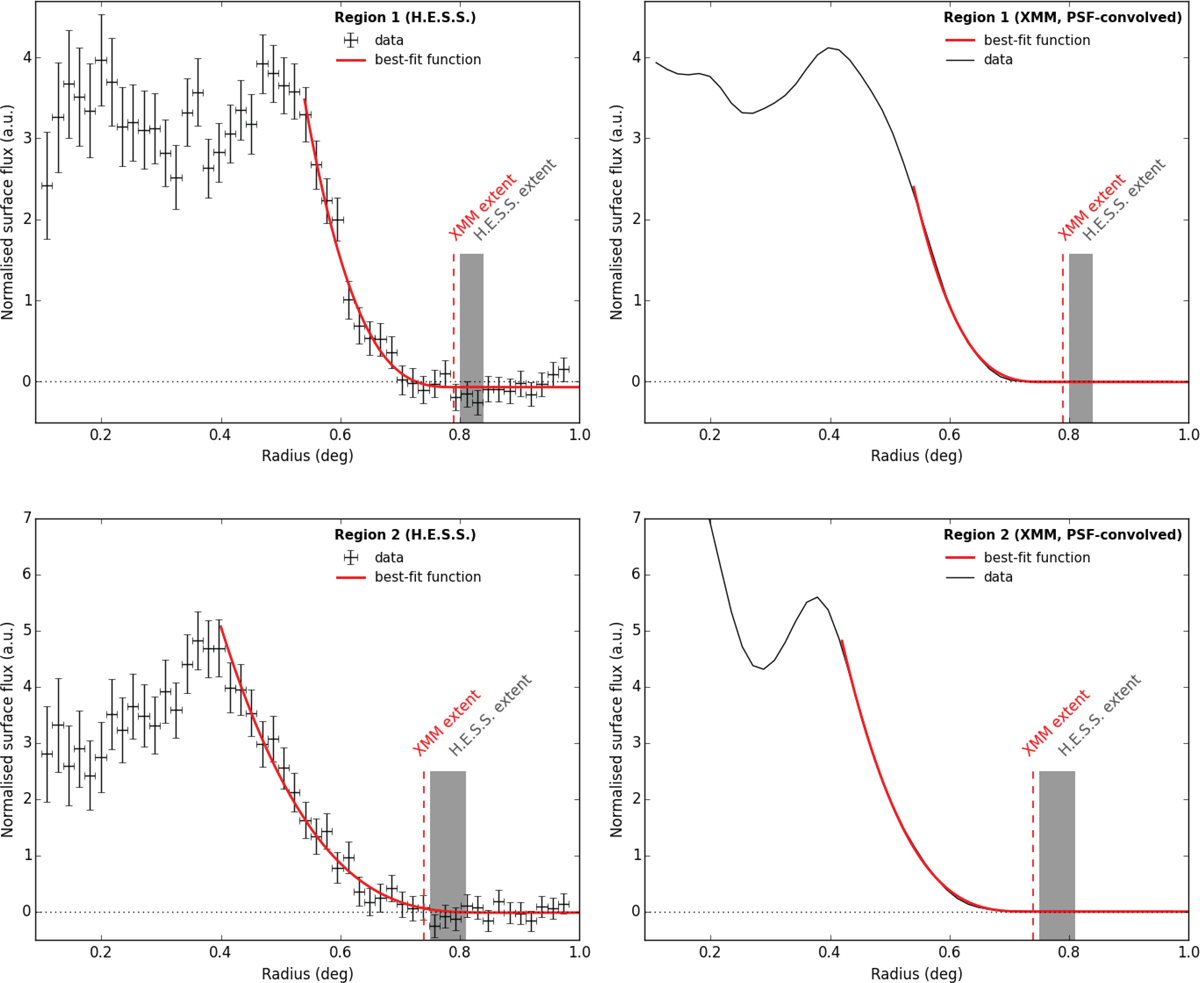
H.E.S.S. radial profiles from RX J1713.7−3946 compared to the XMM-Newton data. For wedges 1 and 2, the profiles are shown on the left in both panels. On the right, the PSF-convolved XMM-Newton profile is shown. For both profiles, the empirical best-fit function is overlaid as red solid line, see Sect. 3 for more details.
Current usage metrics show cumulative count of Article Views (full-text article views including HTML views, PDF and ePub downloads, according to the available data) and Abstracts Views on Vision4Press platform.
Data correspond to usage on the plateform after 2015. The current usage metrics is available 48-96 hours after online publication and is updated daily on week days.
Initial download of the metrics may take a while.