Fig. 5
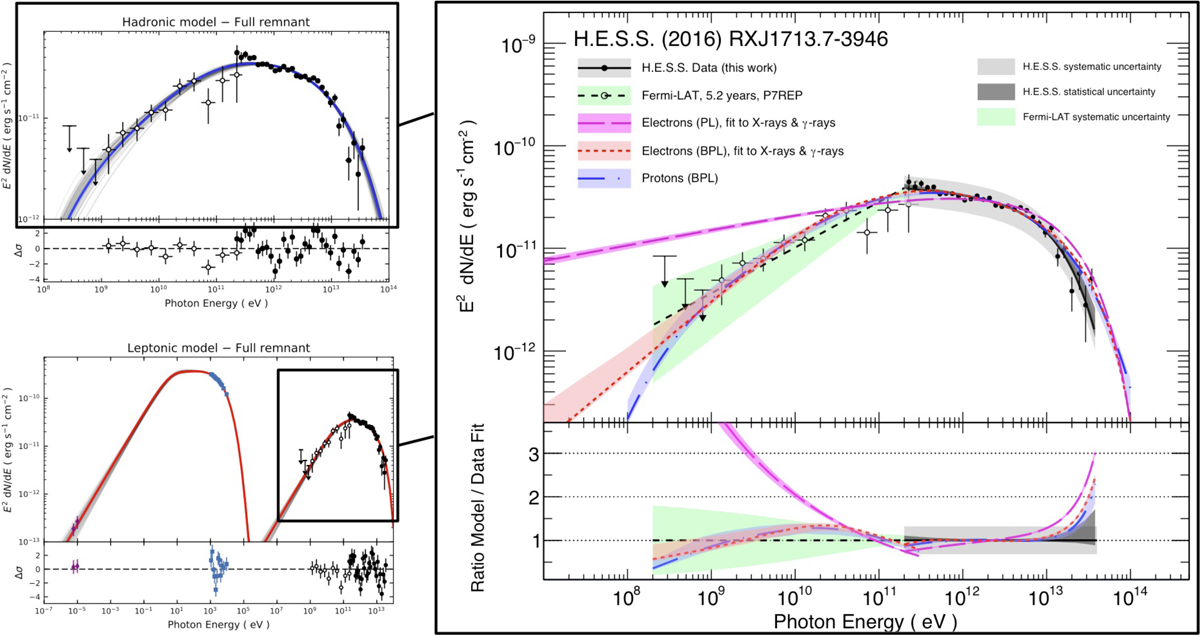
Comparison of hadronic and leptonic models to the data. Top left: the hadronic gamma-ray model obtained with our broadband fit is compared to data. Bottom left: the same plot of the leptonic gamma-ray model compared to data including lower-energy X-rays and radio data. The thick blue and red lines indicate the maximum-likelihood models, and the grey lines surrounding them are the models for 100 samples of the MCMC chain and serve to illustrate the fit uncertainties. The energy flux data points shown from high to low energy are the H.E.S.S. and Fermi-LAT gamma-ray data as solid and open circles, the Suzaku X-ray data and ATCA radio data (Lazendic et al. 2004). The latter flux was determined for the northwest part of the SNR shell only and was scaled up by a factor of two here to represent the whole SNR. Owingto this ad hoc scaling, these points are not included in the fit, but are shown for illustration only. Right-hand side: both leptonic and hadronic models are compared to the Fermi-LAT and H.E.S.S. data points including statistical and systematic uncertainties. In addition to the preferred best-fit models of a broken power law with a cut-off (BPL), a power law without cut-off is also shown for the leptonic model to demonstrate that this model cannot describe the Fermi-LAT gamma-ray data.
Current usage metrics show cumulative count of Article Views (full-text article views including HTML views, PDF and ePub downloads, according to the available data) and Abstracts Views on Vision4Press platform.
Data correspond to usage on the plateform after 2015. The current usage metrics is available 48-96 hours after online publication and is updated daily on week days.
Initial download of the metrics may take a while.