Fig. 4
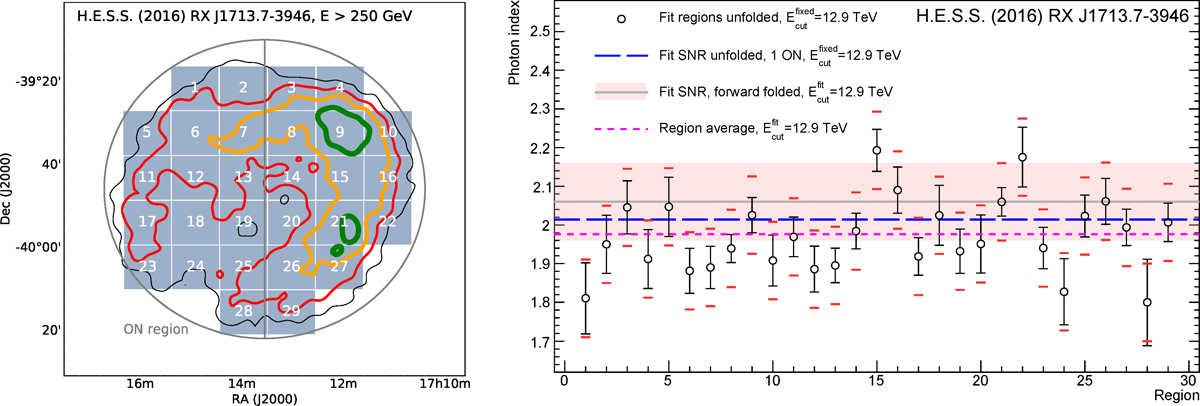
Results of the spatially resolved spectral analysis. On the left-hand side, the 29 regions used for this study are shown, overlaid on the H.E.S.S. gamma-ray significance contours at 3, 5, 7, and 9σ coloured in black, red, orange, and green. The resulting photon index distribution is shown on the right-hand side. The ON region used for the full SNR spectrum is also shown as a grey circle, the vertical grey line bisects the ON region into the western and eastern half also used for the spectral analysis. The error bars on the right-hand side are 1σ statistical fit uncertainties, and the additional red error intervals indicated for each point correspond to the systematic uncertainty on the reconstructed photon index of ΔΓsys = 0.1, which is also shown as light red band around the forward folded SNR photon index.
Current usage metrics show cumulative count of Article Views (full-text article views including HTML views, PDF and ePub downloads, according to the available data) and Abstracts Views on Vision4Press platform.
Data correspond to usage on the plateform after 2015. The current usage metrics is available 48-96 hours after online publication and is updated daily on week days.
Initial download of the metrics may take a while.