Fig. 3
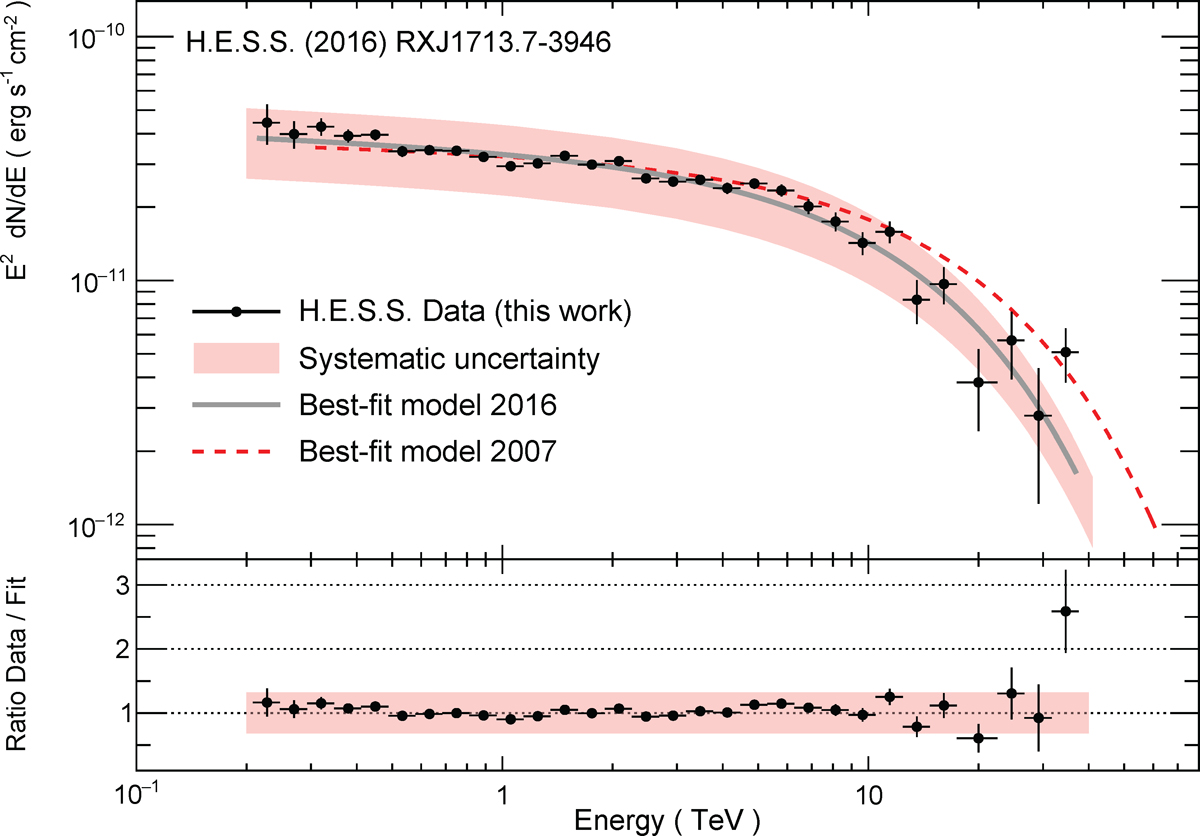
H.E.S.S. energy flux spectrum. Upper panel: the black data points with statistical 1σ error bars are the energy spectrum of the full SNR RX J1713.7–3946, using an extraction radius of 0.6° centred on RA: 17h13m33.6s, Dec: −39d45m36s. The binning is chosen to match the energy resolution, requiring a minimum significance of 2σ per bin. The grey solid line shows the best-fit exponential cutoff power-law model, (2) from Table 3. The dashed red line shows the corresponding best-fit model from the previous H.E.S.S. publication (Aharonian et al. 2007). The experimental flux systematic uncertainty of −32%, described further in the main text, is indicated as a light red band. Lower panel: the residuals are shown including statistical and systematic uncertainties.
Current usage metrics show cumulative count of Article Views (full-text article views including HTML views, PDF and ePub downloads, according to the available data) and Abstracts Views on Vision4Press platform.
Data correspond to usage on the plateform after 2015. The current usage metrics is available 48-96 hours after online publication and is updated daily on week days.
Initial download of the metrics may take a while.