Fig. 2
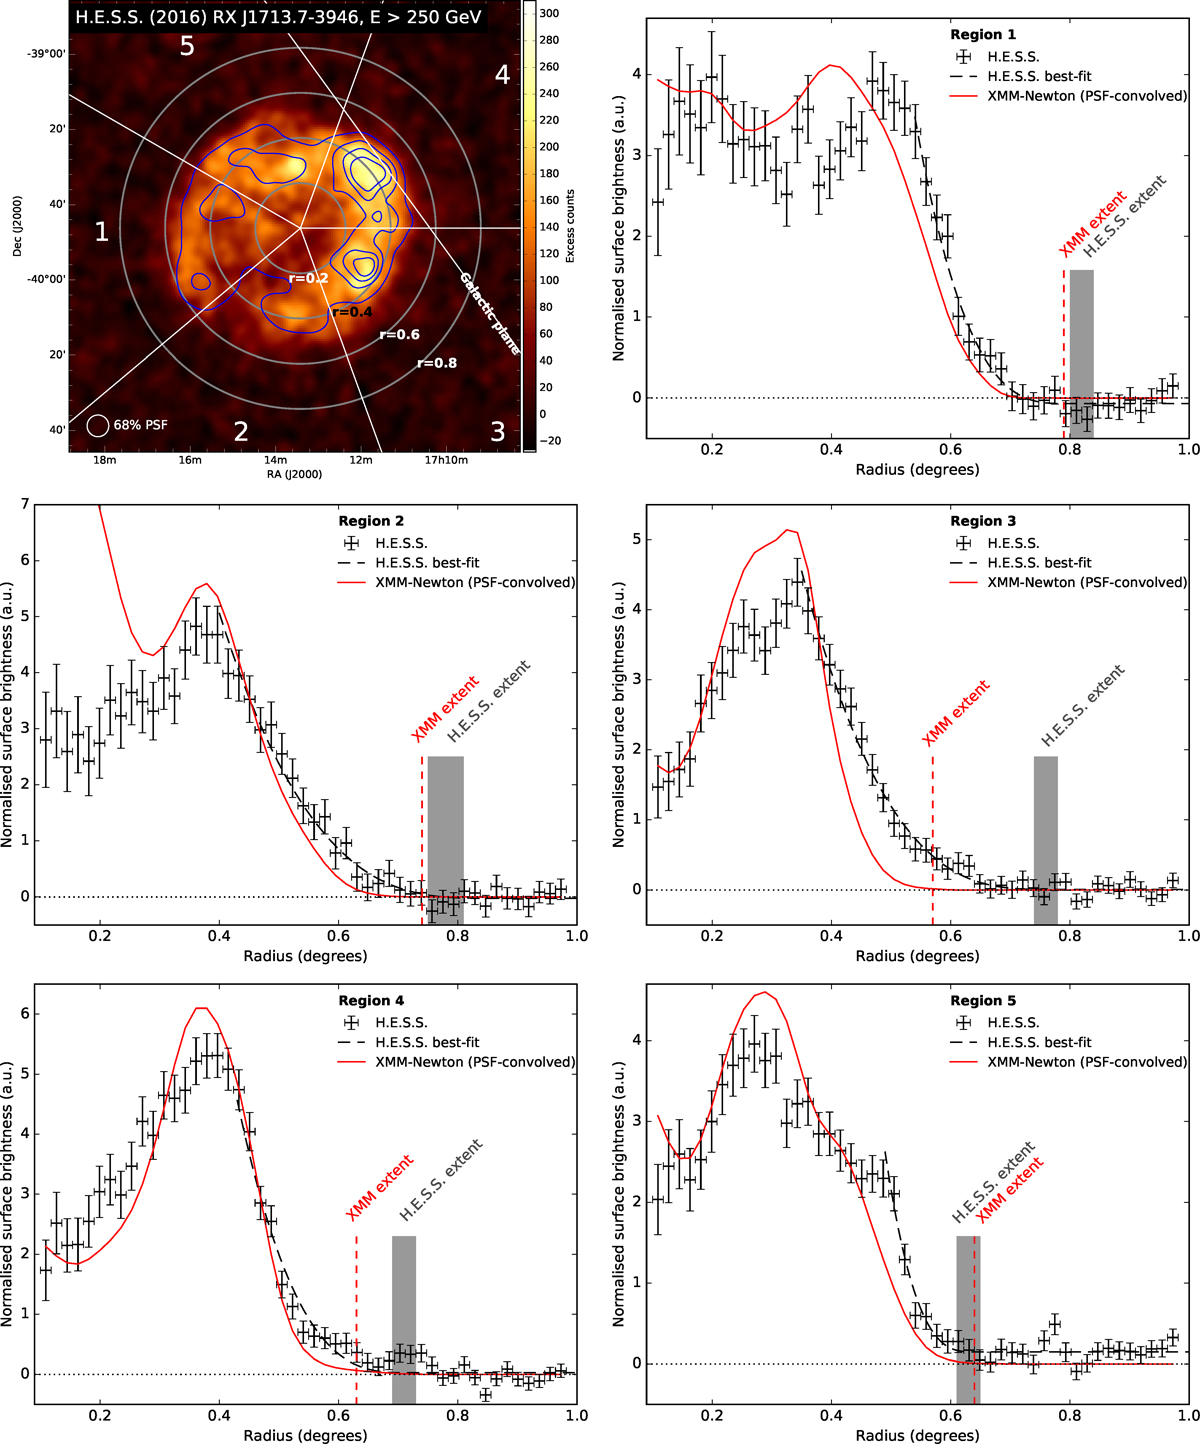
Gamma-ray excess map and radial profiles. Top left: the H.E.S.S. gamma-ray count map (E > 250 GeV) is shown with XMM-Newton X-ray contours (1–10 keV, smoothed with the H.E.S.S. PSF) overlaid. The five regions used to compare the gamma-ray and X-ray data are indicated along with concentric circles (dashed grey lines) with radii of 0.2° to 0.8° and centred at RA: 17h13m25.2s, Dec: −39d46m15.6s. The Galactic plane is also drawn. The other five panels show the radial profiles from these regions. The profiles are extracted from the H.E.S.S. maps (black crosses) and from an XMM-Newton map convolved with the H.E.S.S. PSF (red line). The relative normalisation between the H.E.S.S. and XMM-Newton profiles is chosen such that for regions 1, 2, 4 the integral in [0.3°, 0.7°] is the same, for regions 3, 5 in [0.2°, 0.7°]. The grey shaded area shows the combined statistical and systematic uncertainty band of the radial gamma-ray extension, determined as described in the main text. The vertical dashed red line is the radial X-ray extension. For the X-ray data, the statistical uncertainties are well below 1% and are not shown.
Current usage metrics show cumulative count of Article Views (full-text article views including HTML views, PDF and ePub downloads, according to the available data) and Abstracts Views on Vision4Press platform.
Data correspond to usage on the plateform after 2015. The current usage metrics is available 48-96 hours after online publication and is updated daily on week days.
Initial download of the metrics may take a while.