Fig. D.1
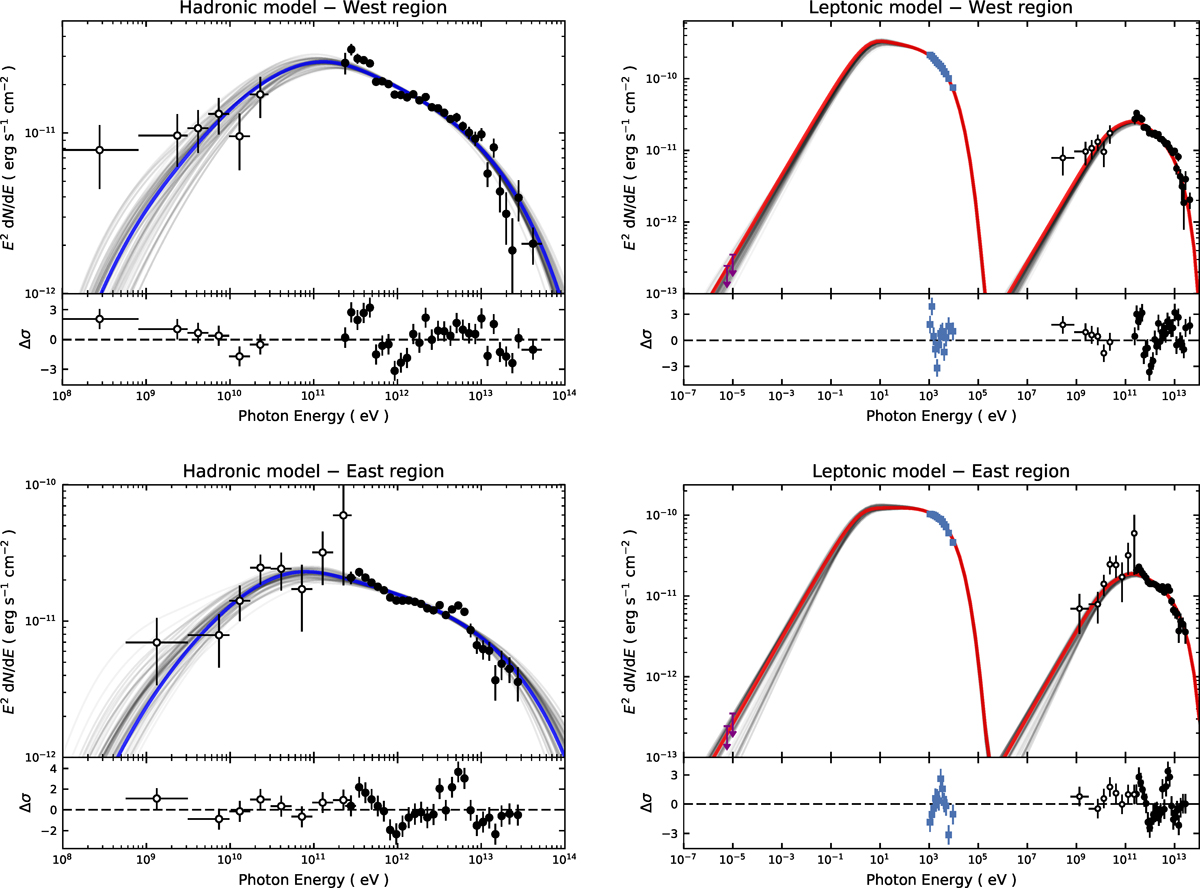
For the western (top) and eastern (bottom) halves of RX J1713.7−3946, the hadronic (left) and leptonic (right) gamma-ray models obtained by our broadband fit are shown in these figures compared to the data. The thick blue and red lines indicate the maximum-likelihood models, and the grey lines surrounding them are the models for 100 samples of the MCMC chain and serve to illustrate the fit uncertainties. The ATCA radio data (Lazendic et al. 2004) of RX J1713.7−3946 plotted as magenta upper limits are determined for the north-west part of the SNR shell only and are scaled up by a factor of two here and included in the fit by constraining the model to stay below these values.
Current usage metrics show cumulative count of Article Views (full-text article views including HTML views, PDF and ePub downloads, according to the available data) and Abstracts Views on Vision4Press platform.
Data correspond to usage on the plateform after 2015. The current usage metrics is available 48-96 hours after online publication and is updated daily on week days.
Initial download of the metrics may take a while.