Fig. A.1
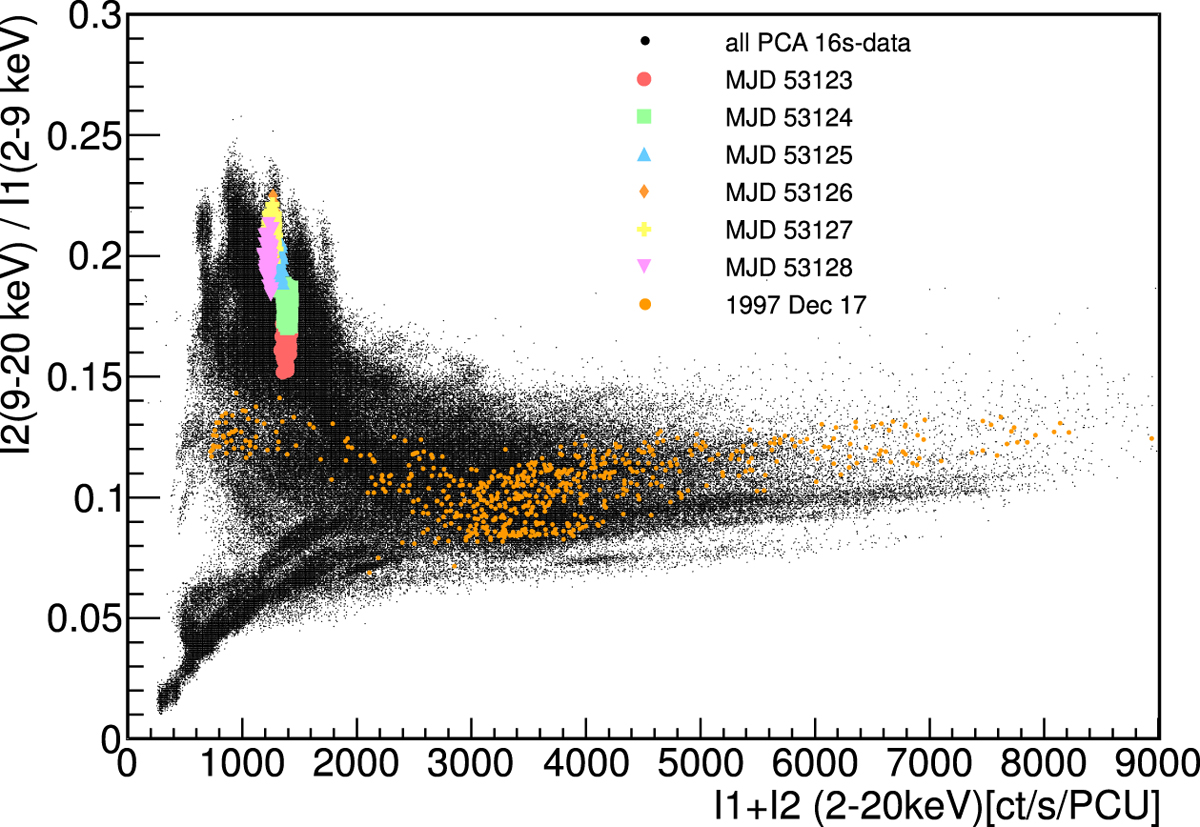
Hardness-intensity diagram of GRS 1915+105 derived from the entire archival RXTE PCA data set. The temporal sampling is 16 s. Hardness is defined as the ratio of fluxes measured in the 2−9 keV and 9−20 keV bands, while intensity is defined as the sum of the band-limited fluxes in units of counts per second. Data corresponding to H.E.S.S. observations are highlighted using symbols to identify the individual days of observation. For comparison, the data corresponding to noteworthy events such as known flares observed by RXTE are also plotted (see e.g. Soleri et al. 2006).
Current usage metrics show cumulative count of Article Views (full-text article views including HTML views, PDF and ePub downloads, according to the available data) and Abstracts Views on Vision4Press platform.
Data correspond to usage on the plateform after 2015. The current usage metrics is available 48-96 hours after online publication and is updated daily on week days.
Initial download of the metrics may take a while.