Fig. 1
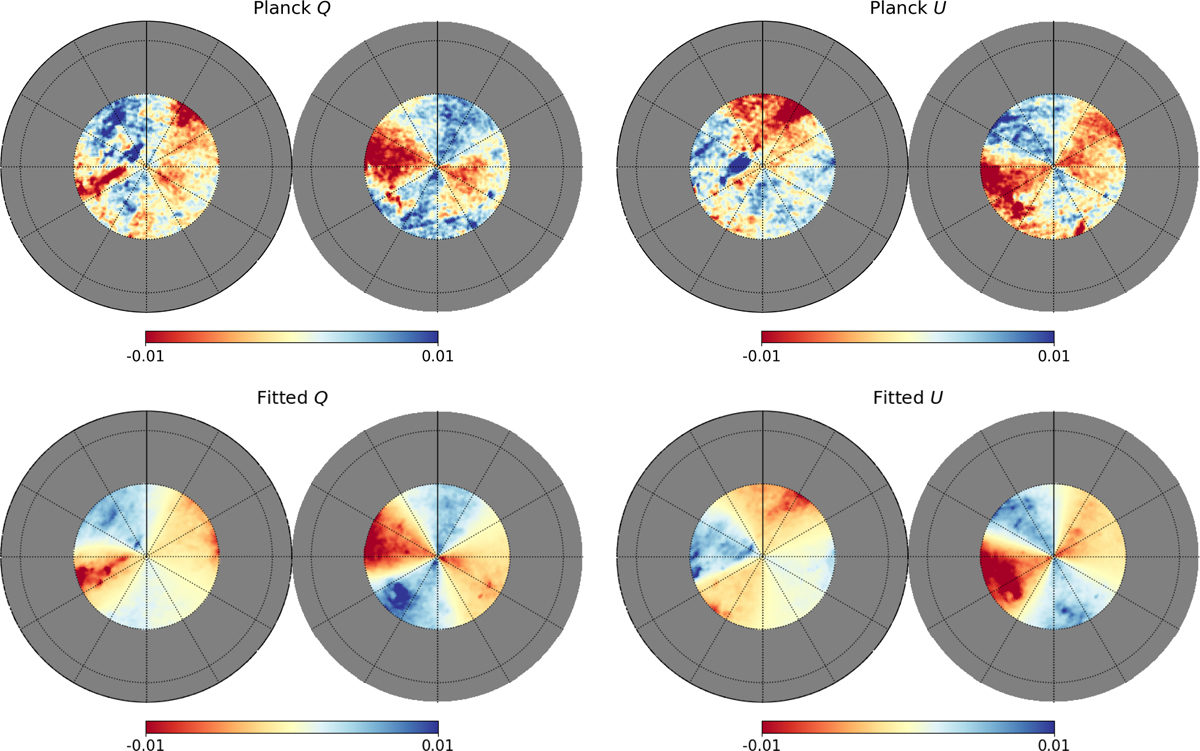
Observed (top) and fitted (bottom) Q (left) and U (right) Stokes parameter maps in orthographic projection, in units of MJy sr−1 . Each pair of maps shows the sky divided into its two Galactic hemispheres: north (left) and south (right). The vertical full line in each map indicates ℓ = 0°. The grey regions correspond to the areas that are masked. The texture seen in the model maps, overlaid on the regular patterns, arises from the intensity I. Planck observations show additional structure from the turbulent component of the magnetic field, not included in our model.
Current usage metrics show cumulative count of Article Views (full-text article views including HTML views, PDF and ePub downloads, according to the available data) and Abstracts Views on Vision4Press platform.
Data correspond to usage on the plateform after 2015. The current usage metrics is available 48-96 hours after online publication and is updated daily on week days.
Initial download of the metrics may take a while.