Fig. 5
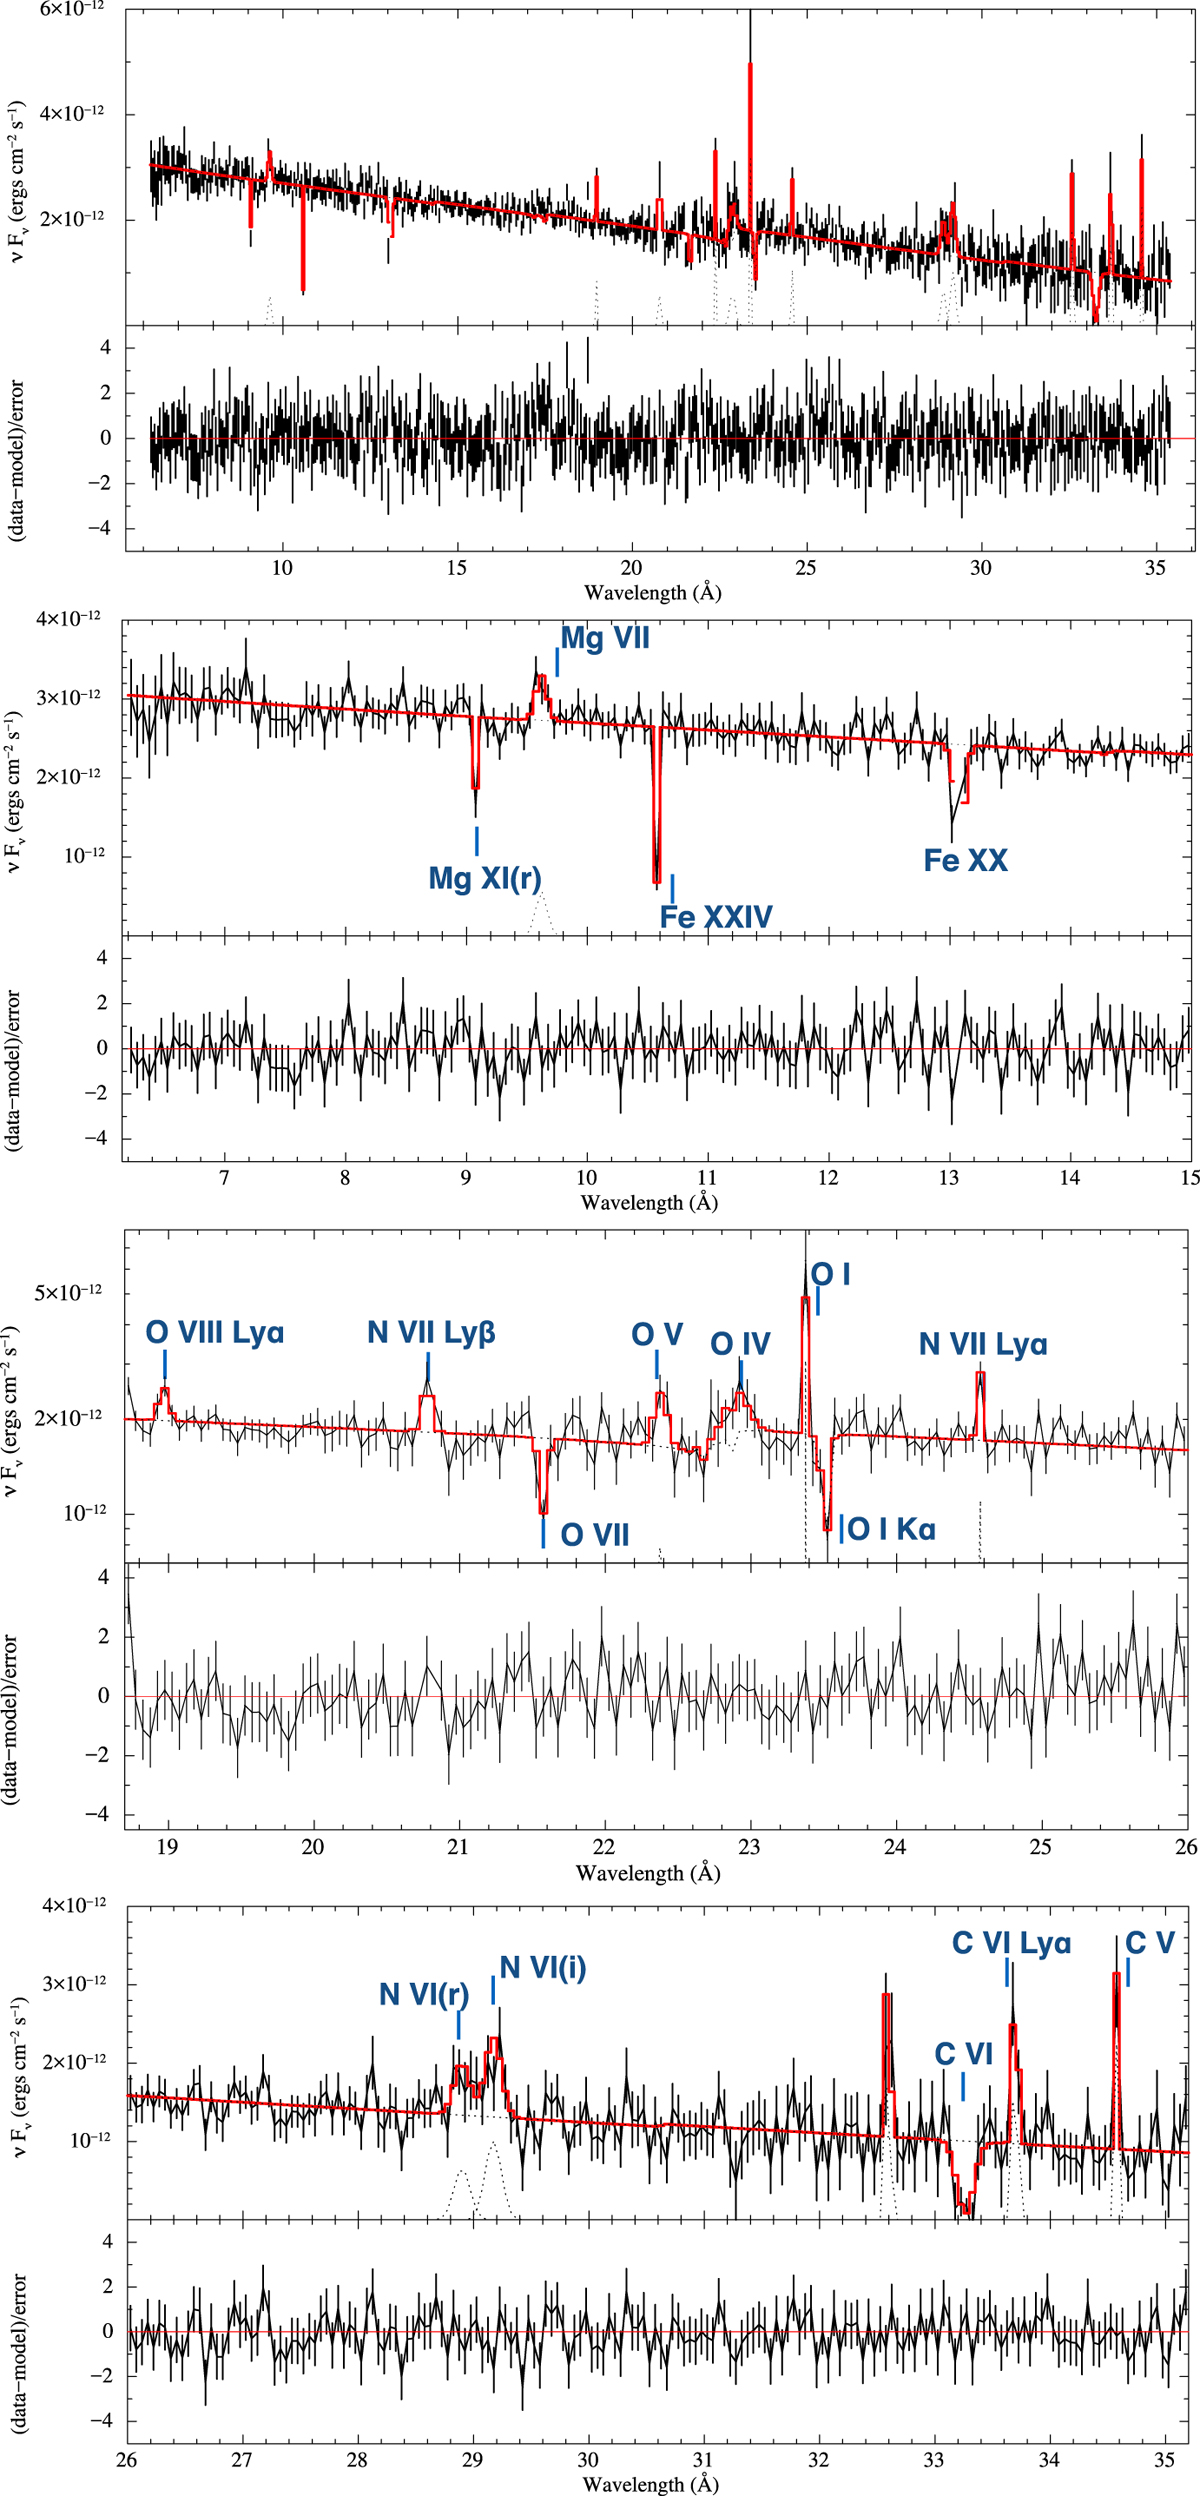
Unfolded RGS first-order spectrum of J1023 in the 6.2–35.4 Å wavelength range (top panel) and in selected wavelength ranges (in order of increasing wavelength from top to bottom). The red solid line represents the best-fitting model (see the text for details). The wavelengths of the most relevant transitions are labelled in blue. Post-fit residuals are also shown.
Current usage metrics show cumulative count of Article Views (full-text article views including HTML views, PDF and ePub downloads, according to the available data) and Abstracts Views on Vision4Press platform.
Data correspond to usage on the plateform after 2015. The current usage metrics is available 48-96 hours after online publication and is updated daily on week days.
Initial download of the metrics may take a while.