Fig. 4
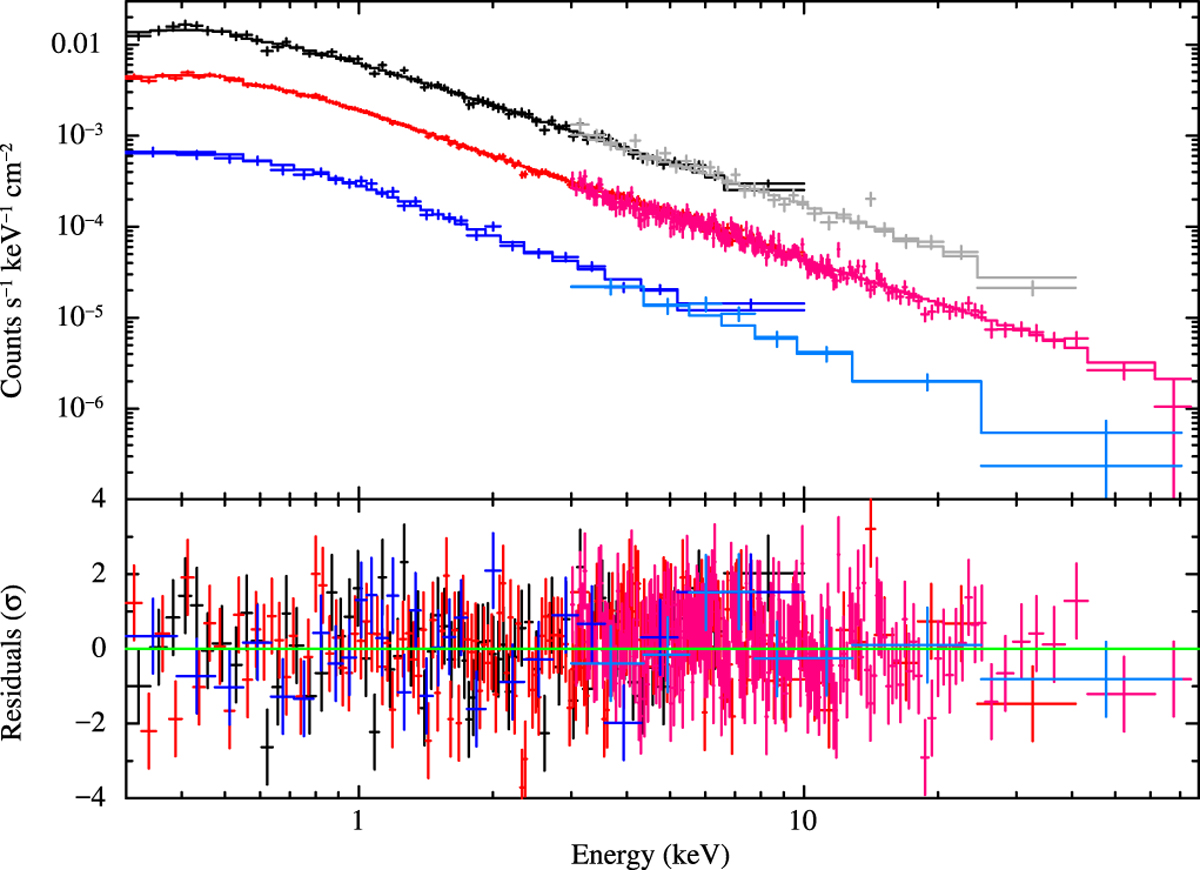
Broadband X-ray spectra of J1023 relative to the three X-ray modes from simultaneous XMM–Newton and NuSTAR data. For plotting purposes, only the XMM–Newton EPIC MOS1 (0.3–10 keV) and NuSTAR FPMA (3–79 keV) spectra are shown. Data have been re-binned to better visualise the trend in the spectral residuals. The best-fitting model is indicated by the solid lines. High- and low-mode spectra were fitted using the same model described by Campana et al. (2016; see Sect. 4.2), whereas flare spectra were fitted separately with an absorbed power law model (see Sect. 4.3). Black and grey refer to the flaring mode, red and magenta to the high mode, and blue and cyan to the low mode. Post-fit residuals in units of standard deviations are also shown in the bottom panel.
Current usage metrics show cumulative count of Article Views (full-text article views including HTML views, PDF and ePub downloads, according to the available data) and Abstracts Views on Vision4Press platform.
Data correspond to usage on the plateform after 2015. The current usage metrics is available 48-96 hours after online publication and is updated daily on week days.
Initial download of the metrics may take a while.