Fig. 3
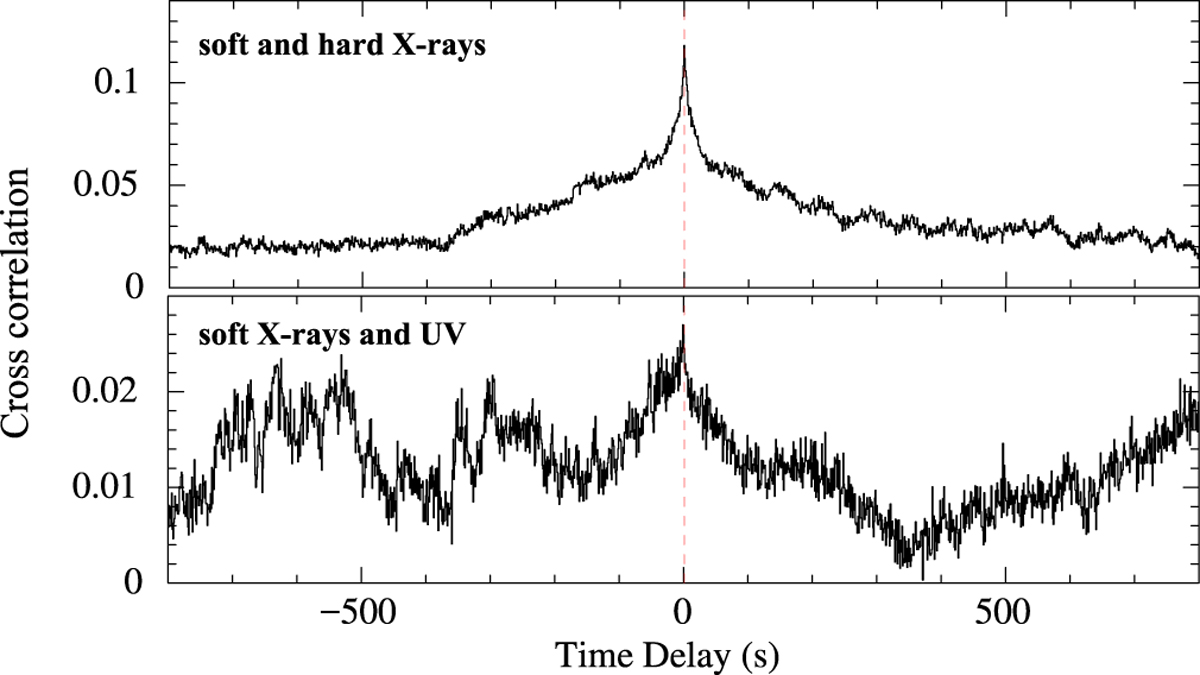
Results of the cross-correlation between the time series in the 0.3–10 keV and 10–79 keV energy bands (top panel), and in the UV and the 0.3–10 keV bands (bottom panel). In both panels lags are defined in such a way that positive time delays refer to the pn data with respect to FPM data (top), and to the pn data with respect to the UVOT data(bottom). In both panels the red dashed line marks the case of no time lag. We note the different interval on the vertical axis.
Current usage metrics show cumulative count of Article Views (full-text article views including HTML views, PDF and ePub downloads, according to the available data) and Abstracts Views on Vision4Press platform.
Data correspond to usage on the plateform after 2015. The current usage metrics is available 48-96 hours after online publication and is updated daily on week days.
Initial download of the metrics may take a while.