Fig. 2
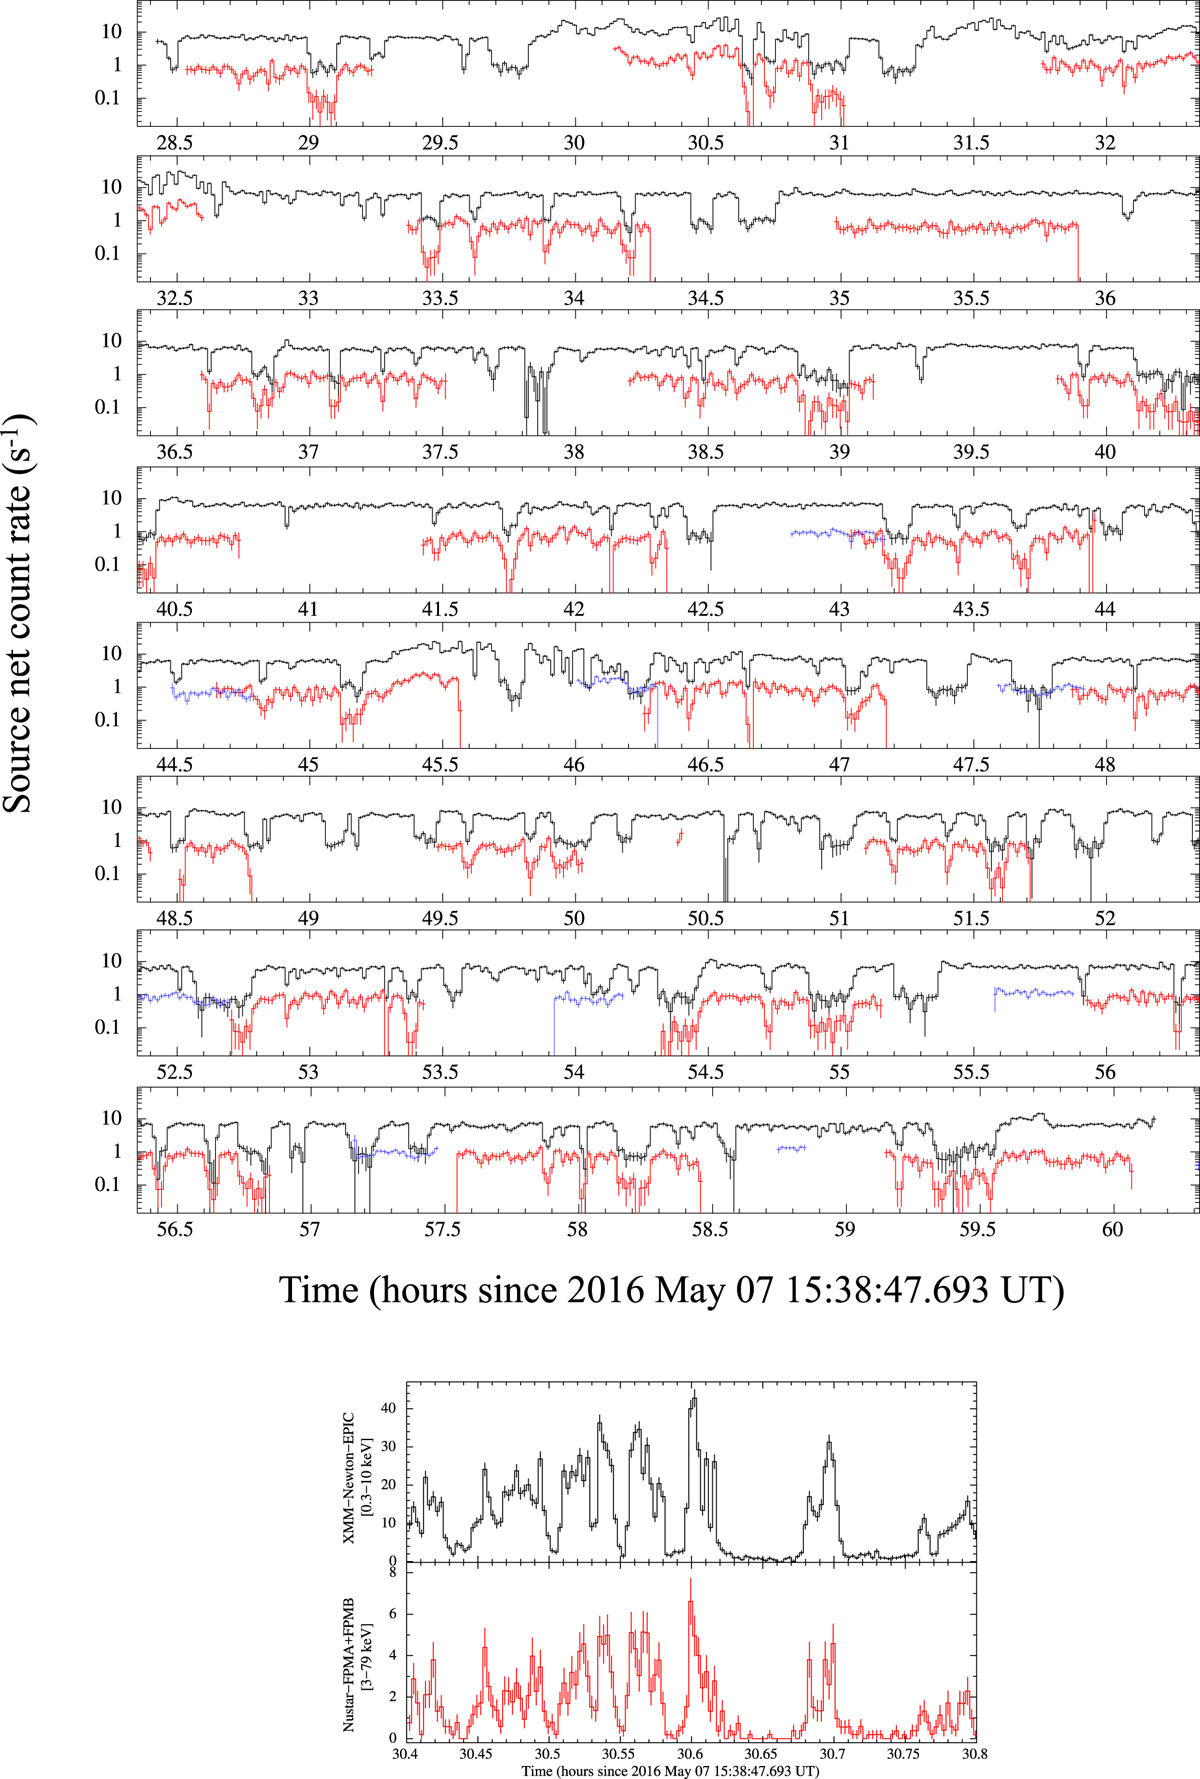
Top: background-subtracted and exposure-corrected light curves of J1023 obtained with the XMM–Newton EPIC cameras (0.3–10 keV; black data), NuSTAR FPMA + FPMB (3–79 keV; red data) and Swift UVOT (UV M2 filter; blue data) during the time interval covered by XMM–Newton. For plotting purposes, light curves are shown with a binning time of 50 s and the vertical axis is plotted in logarithmic scale. Bottom: zoom of the XMM–Newton EPIC and NuSTAR FPMA + FPMB light curves around the longest and brightest flaring episode detected in the data. Light curves are shown with a binning time of 10 s and the vertical axis is plotted in linear scale.
Current usage metrics show cumulative count of Article Views (full-text article views including HTML views, PDF and ePub downloads, according to the available data) and Abstracts Views on Vision4Press platform.
Data correspond to usage on the plateform after 2015. The current usage metrics is available 48-96 hours after online publication and is updated daily on week days.
Initial download of the metrics may take a while.