Fig. 9
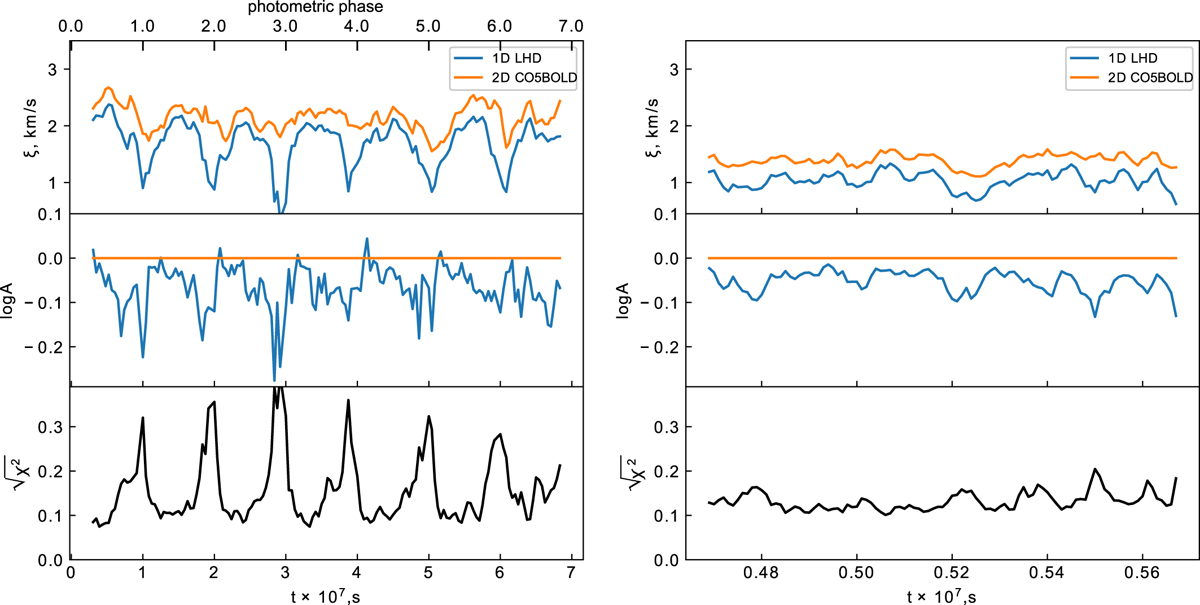
Result of the two-parametric fitting for the
pulsating (left panel) and non-pulsating (right
panel) regimes. The parameters of the 2D model
are shown by orange lines for both regimes. The
reconstructed parameters with the 1D LHD grid are
shown byblue lines. The relative RMS deviation
![]() in line strengths between the 2D and 1D models is shown
by black line.
in line strengths between the 2D and 1D models is shown
by black line.
Current usage metrics show cumulative count of Article Views (full-text article views including HTML views, PDF and ePub downloads, according to the available data) and Abstracts Views on Vision4Press platform.
Data correspond to usage on the plateform after 2015. The current usage metrics is available 48-96 hours after online publication and is updated daily on week days.
Initial download of the metrics may take a while.