Fig. 7
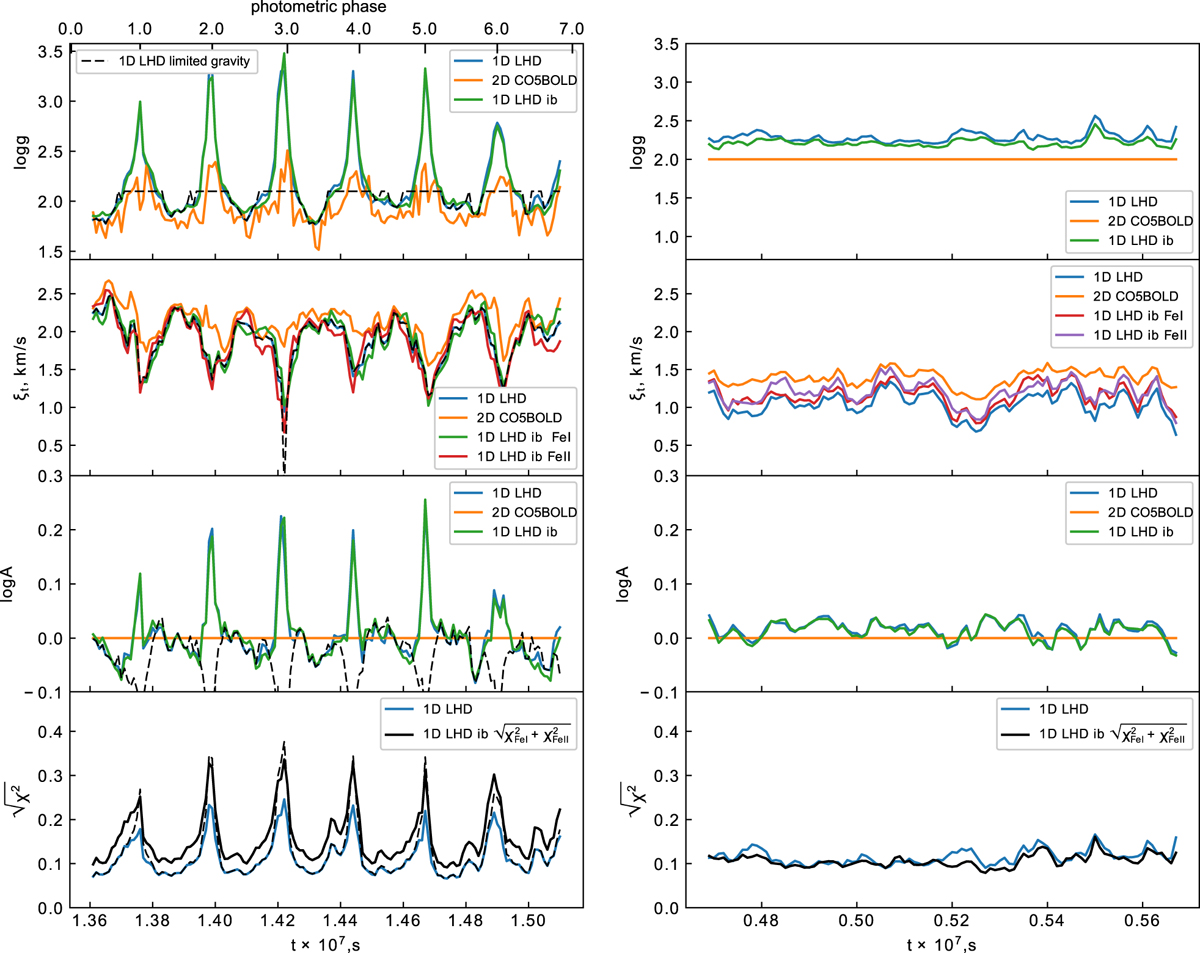
Result of the three-parameter fitting for the pulsating
(left panel) and non-pulsating (right panel) regimes. The
parameters of the 2D model are shown by orange lines
for both regimes. The reconstructed parameters with the
direct three-parameter fitting using the 1D LHD grid are
shown by blue lines. Results using the ionization balance
are shown by green, brown, and solid black lines. For
the pulsating regime, the result of the experiment with a
gravity limitfor the maximum compression phase is shown
by the dashed black line. The relative RMS deviation
![]() in line strengths between the 2D and 1D models is
shown by the solid blue and black lines for the direct
three-parameter fitting and for a fitting using the ionization
balance condition, respectively.
in line strengths between the 2D and 1D models is
shown by the solid blue and black lines for the direct
three-parameter fitting and for a fitting using the ionization
balance condition, respectively.
Current usage metrics show cumulative count of Article Views (full-text article views including HTML views, PDF and ePub downloads, according to the available data) and Abstracts Views on Vision4Press platform.
Data correspond to usage on the plateform after 2015. The current usage metrics is available 48-96 hours after online publication and is updated daily on week days.
Initial download of the metrics may take a while.