Free Access
Fig. 6
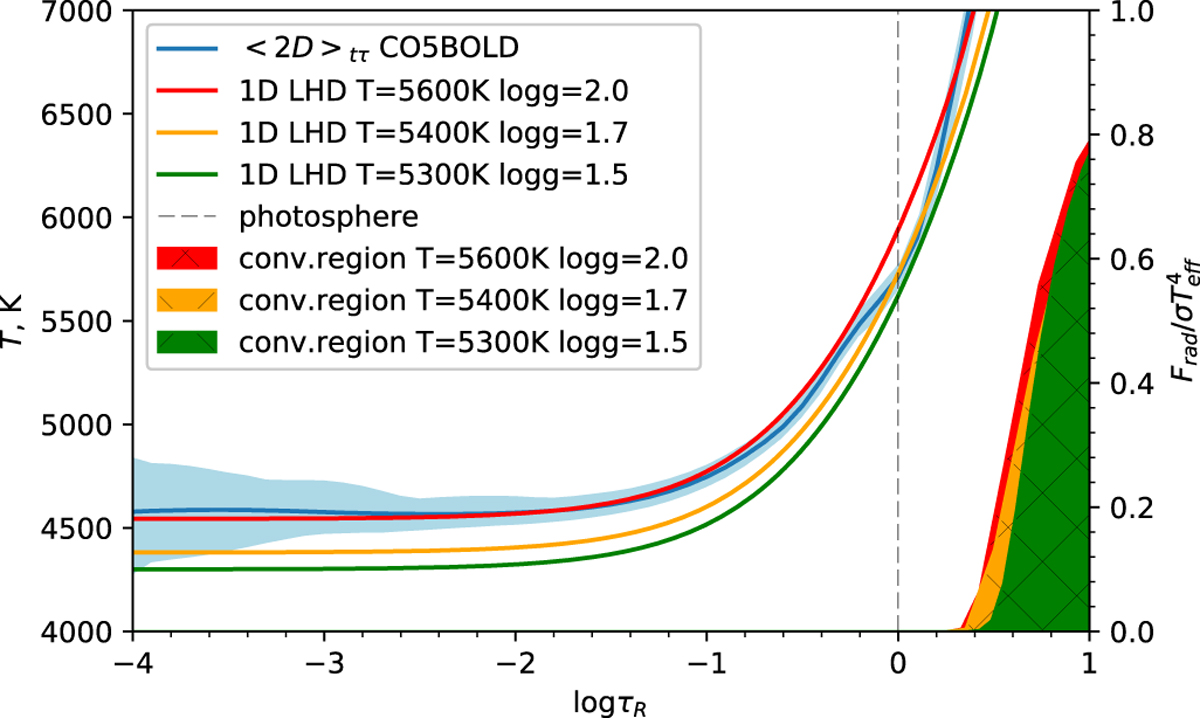
Comparison of the thermal structures of the horizontally (on surfaces of constant optical depth) averaged 2Dmodel 1D models for the case when pulsations have not set in. The mean 2D thermal structure varies during 99 instances in time within the light blue region. The temporally averaged 2D profile is shown in blue.
Current usage metrics show cumulative count of Article Views (full-text article views including HTML views, PDF and ePub downloads, according to the available data) and Abstracts Views on Vision4Press platform.
Data correspond to usage on the plateform after 2015. The current usage metrics is available 48-96 hours after online publication and is updated daily on week days.
Initial download of the metrics may take a while.