Fig. 3
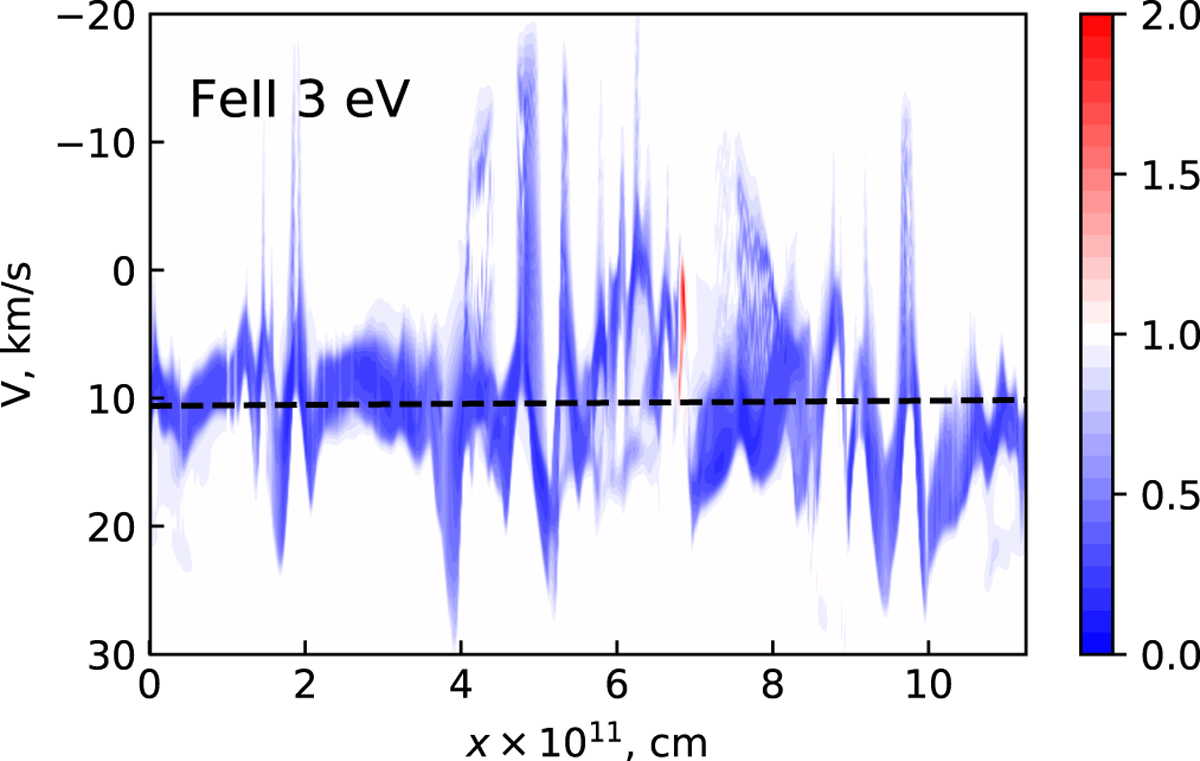
Two-dimensional map of normalized line profiles ofthe strongest Fe ii 3 eV line in terms of normalized intensity for a photometric phase of ϕph = 0.56. The horizontal axis shows the horizontal spatial position within the modeled box. The vertical axis represents the wavelength expressed as Doppler velocity. Emission and absorption are indicated by red and blue lines, respectively. The continuum level is one, and it is shown in white. The mean Doppler velocity is depicted by the dashed line. The standard deviation of the Doppler shift velocities is 6.1 km s−1 .
Current usage metrics show cumulative count of Article Views (full-text article views including HTML views, PDF and ePub downloads, according to the available data) and Abstracts Views on Vision4Press platform.
Data correspond to usage on the plateform after 2015. The current usage metrics is available 48-96 hours after online publication and is updated daily on week days.
Initial download of the metrics may take a while.