Free Access
Fig. 1
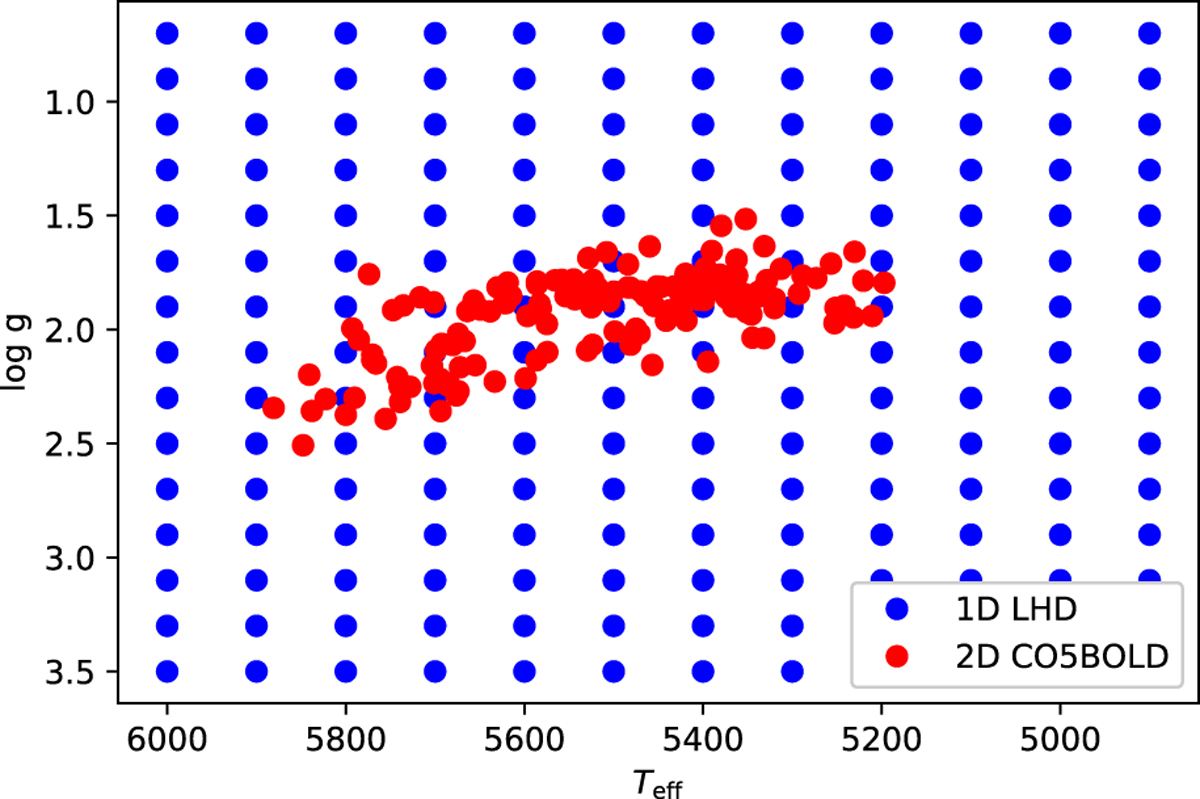
Grid of 1D hydrostatic LHD models (blue circles) in the Teff – log g plane, and effective temperatures and gravities of the 2D model (red circles) for 150 instances in time, covering six full periods of pulsation.
Current usage metrics show cumulative count of Article Views (full-text article views including HTML views, PDF and ePub downloads, according to the available data) and Abstracts Views on Vision4Press platform.
Data correspond to usage on the plateform after 2015. The current usage metrics is available 48-96 hours after online publication and is updated daily on week days.
Initial download of the metrics may take a while.