Fig. 7
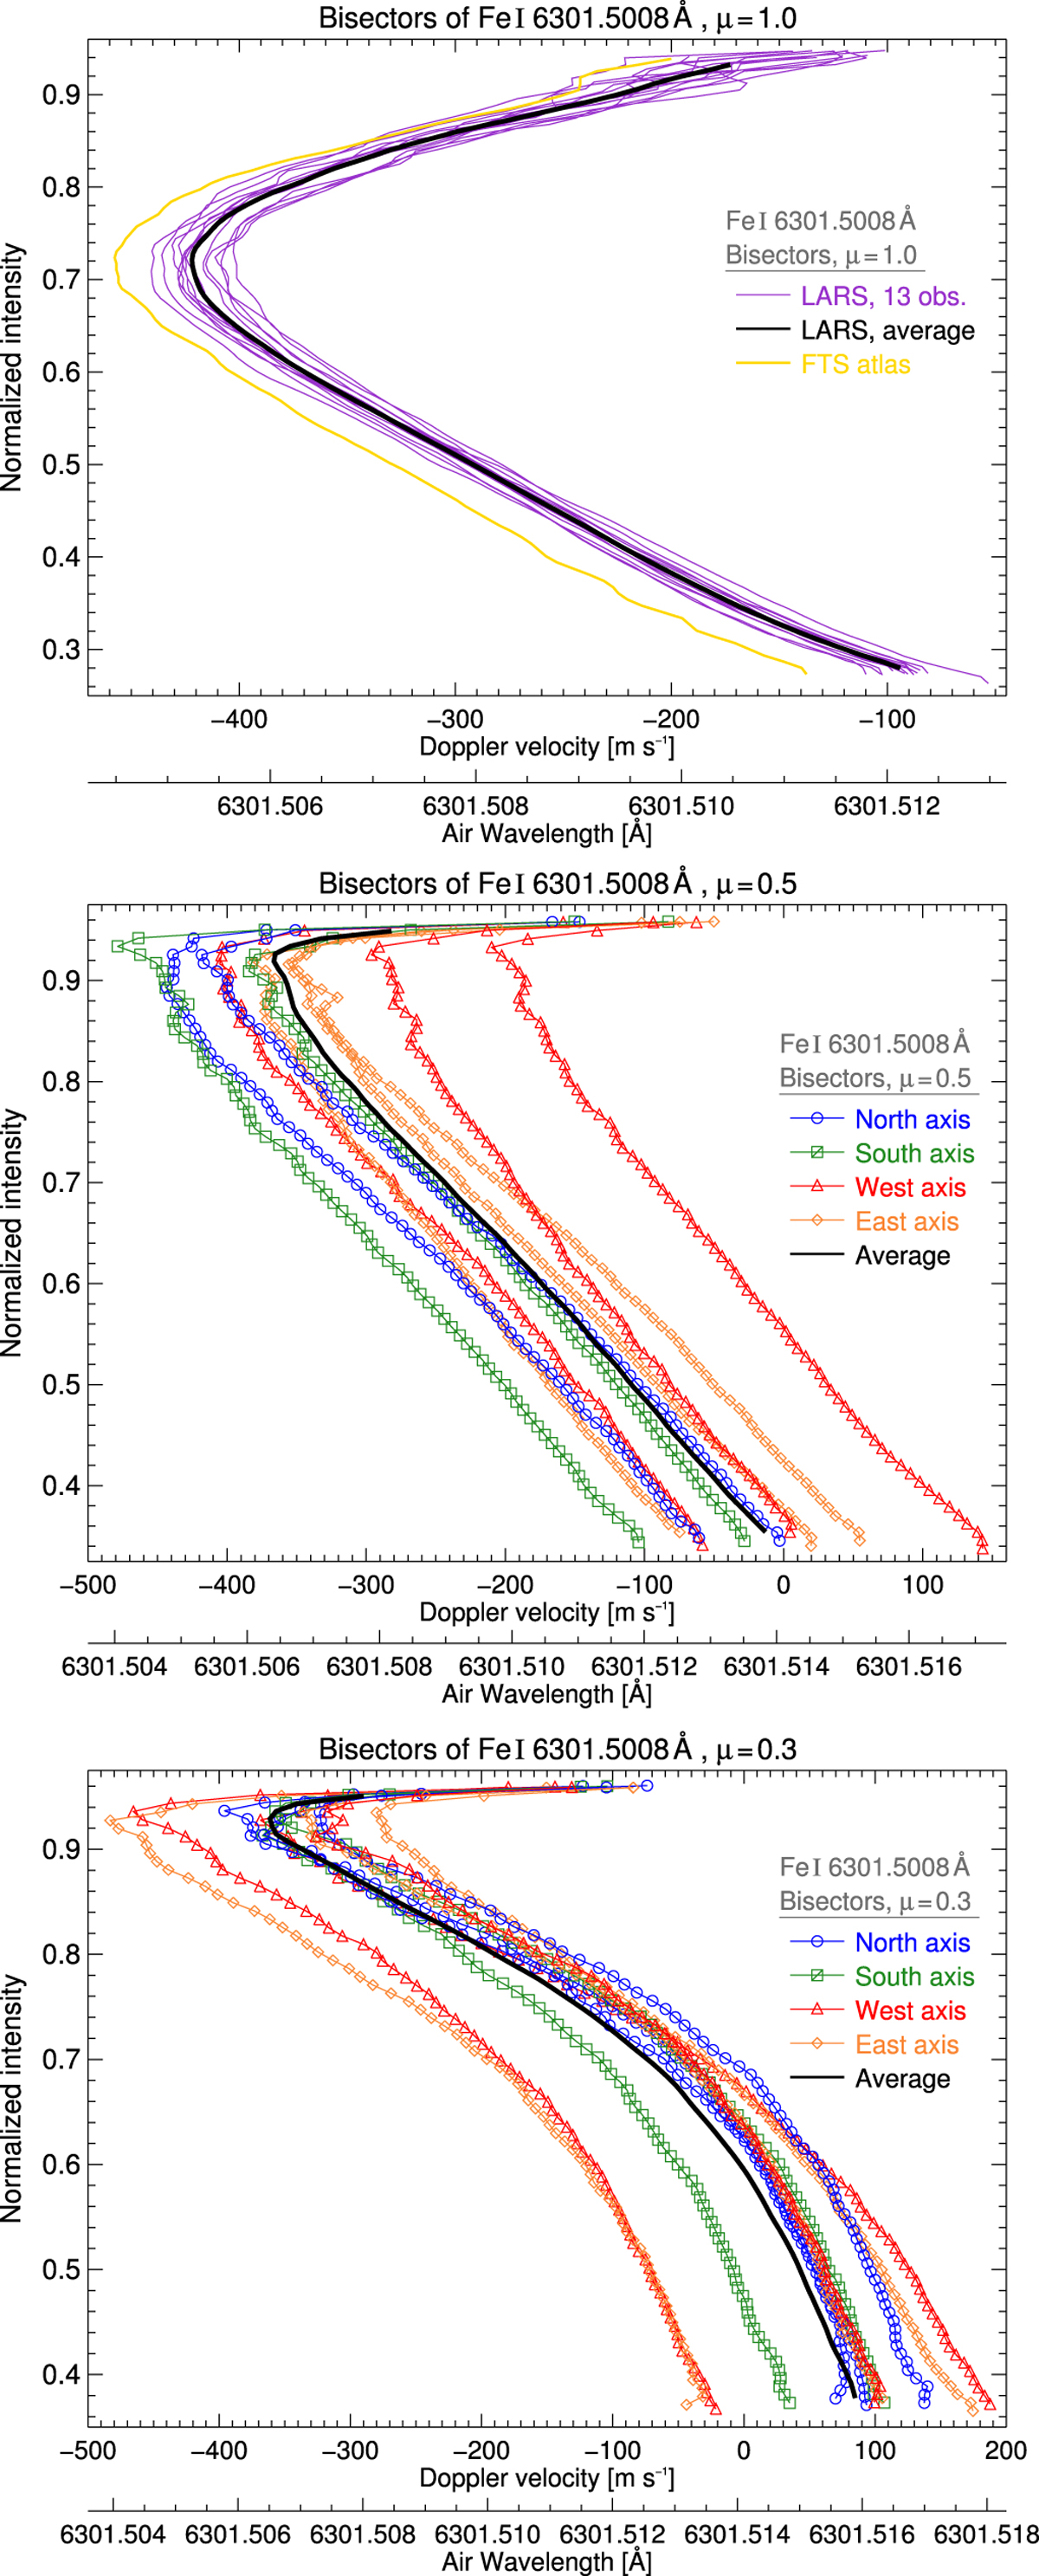
Bisectors of Fe I 6301.5 Å at three different heliocentric positions on the solar disk: μ = 1.0 (top panel), μ = 0.5 (center panel), and μ = 0.3 (bottom panel). The intensity was normalized to the spectral continuum, the convective shifts are given in air wavelength (in Å) and derived Doppler velocities (in m s−1). Each curve represents the average bisectors of a sequence. The colors and symbols correspond to the respective solar axis (see Fig. 3). The black solid lines are the average bisectors of all measurements at the respective heliocentric position. The FTS line bisector is added as yellow curve in the top panel.
Current usage metrics show cumulative count of Article Views (full-text article views including HTML views, PDF and ePub downloads, according to the available data) and Abstracts Views on Vision4Press platform.
Data correspond to usage on the plateform after 2015. The current usage metrics is available 48-96 hours after online publication and is updated daily on week days.
Initial download of the metrics may take a while.