Fig. 6
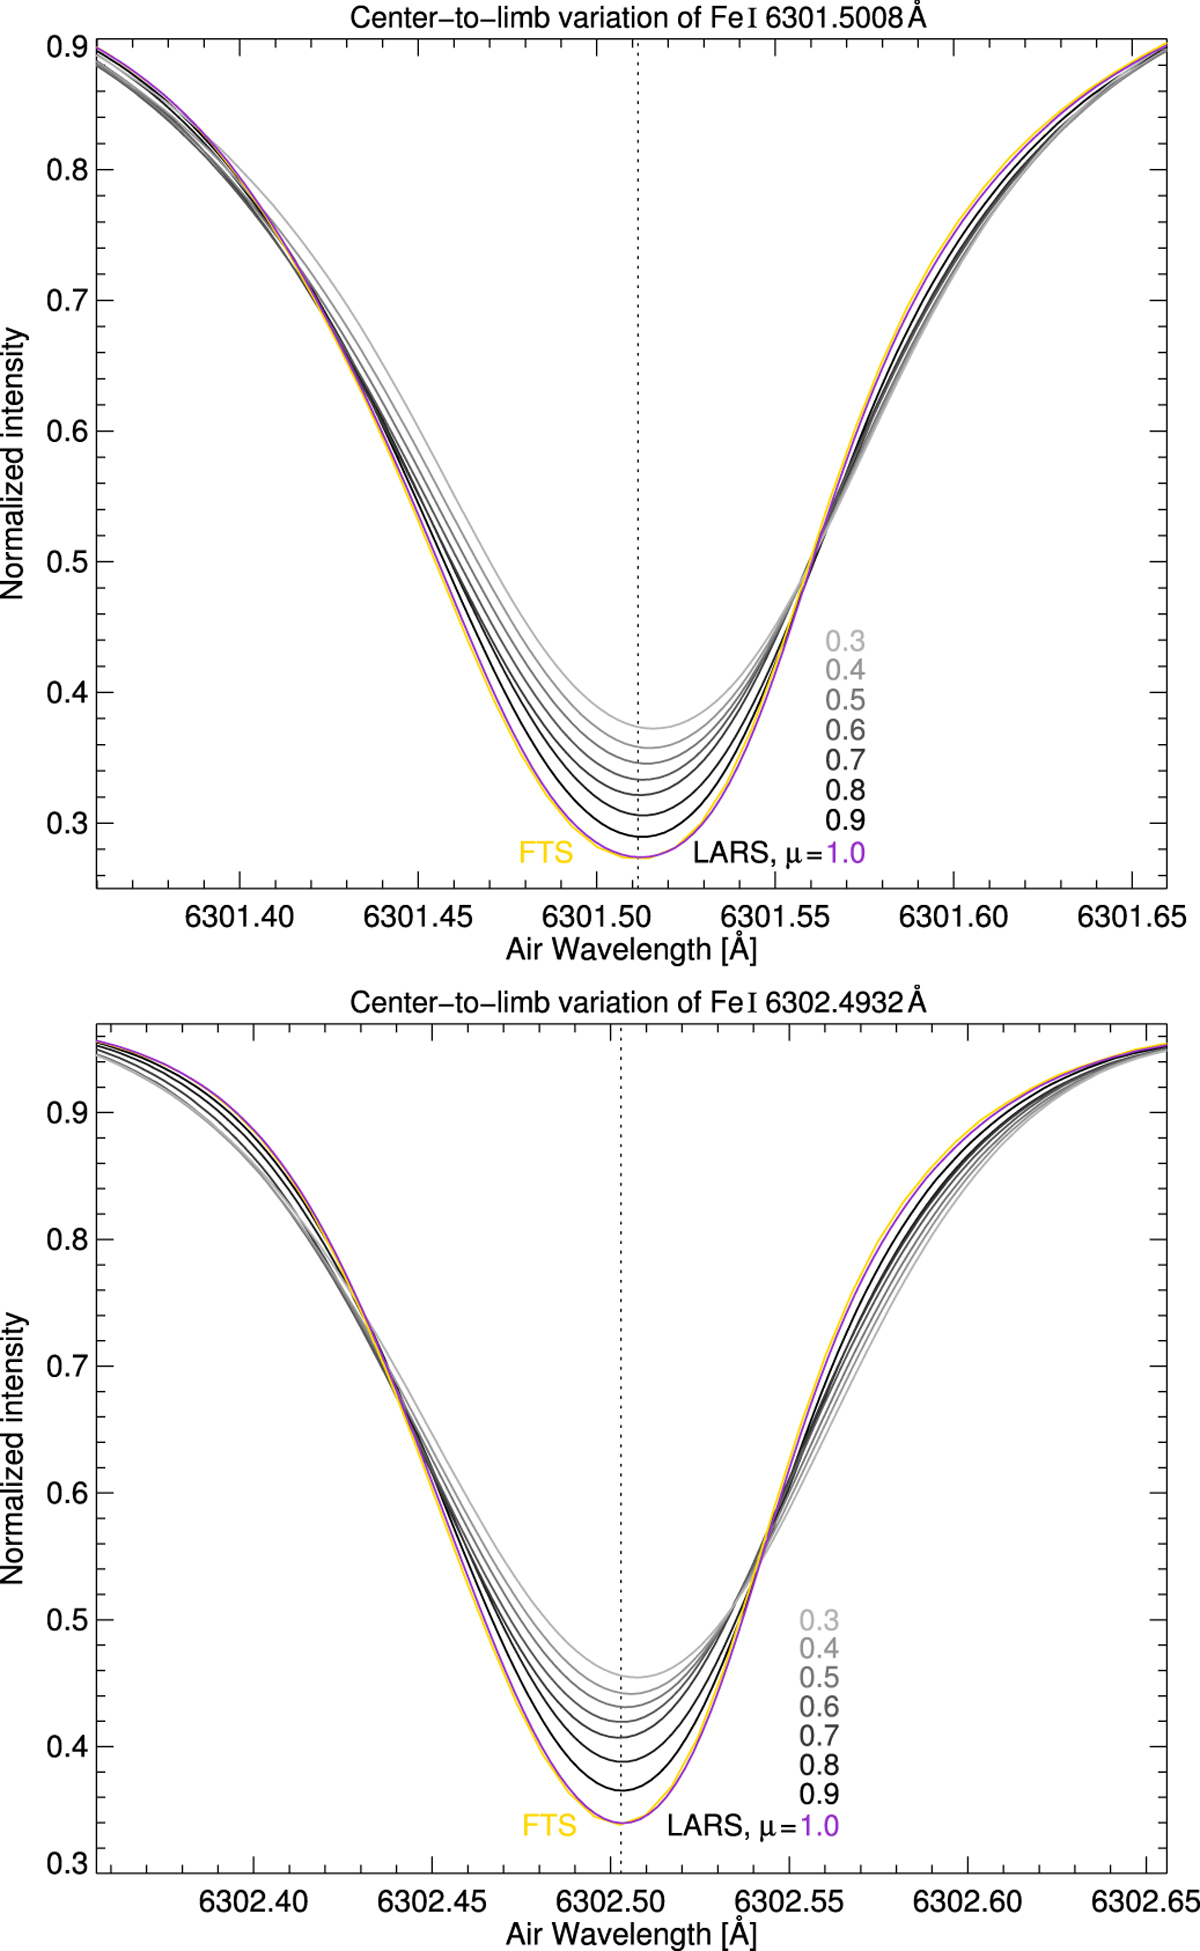
Variation of the Fe I 6301.5 Å (upper panel) and Fe I 6302.5 Å (lower panel) line shapes from the disk center (μ = 1.0, purple line) toward the solar limb (μ = 0.3, with decreasing gray scale). The intensities of the profiles were normalized to the spectral continuum and are plotted against the air wavelength (in Å). The FTS atlas profile is added in yellow for direct comparison. The line minimum at μ = 1.0 is marked by the dotted line.
Current usage metrics show cumulative count of Article Views (full-text article views including HTML views, PDF and ePub downloads, according to the available data) and Abstracts Views on Vision4Press platform.
Data correspond to usage on the plateform after 2015. The current usage metrics is available 48-96 hours after online publication and is updated daily on week days.
Initial download of the metrics may take a while.