Fig. 5
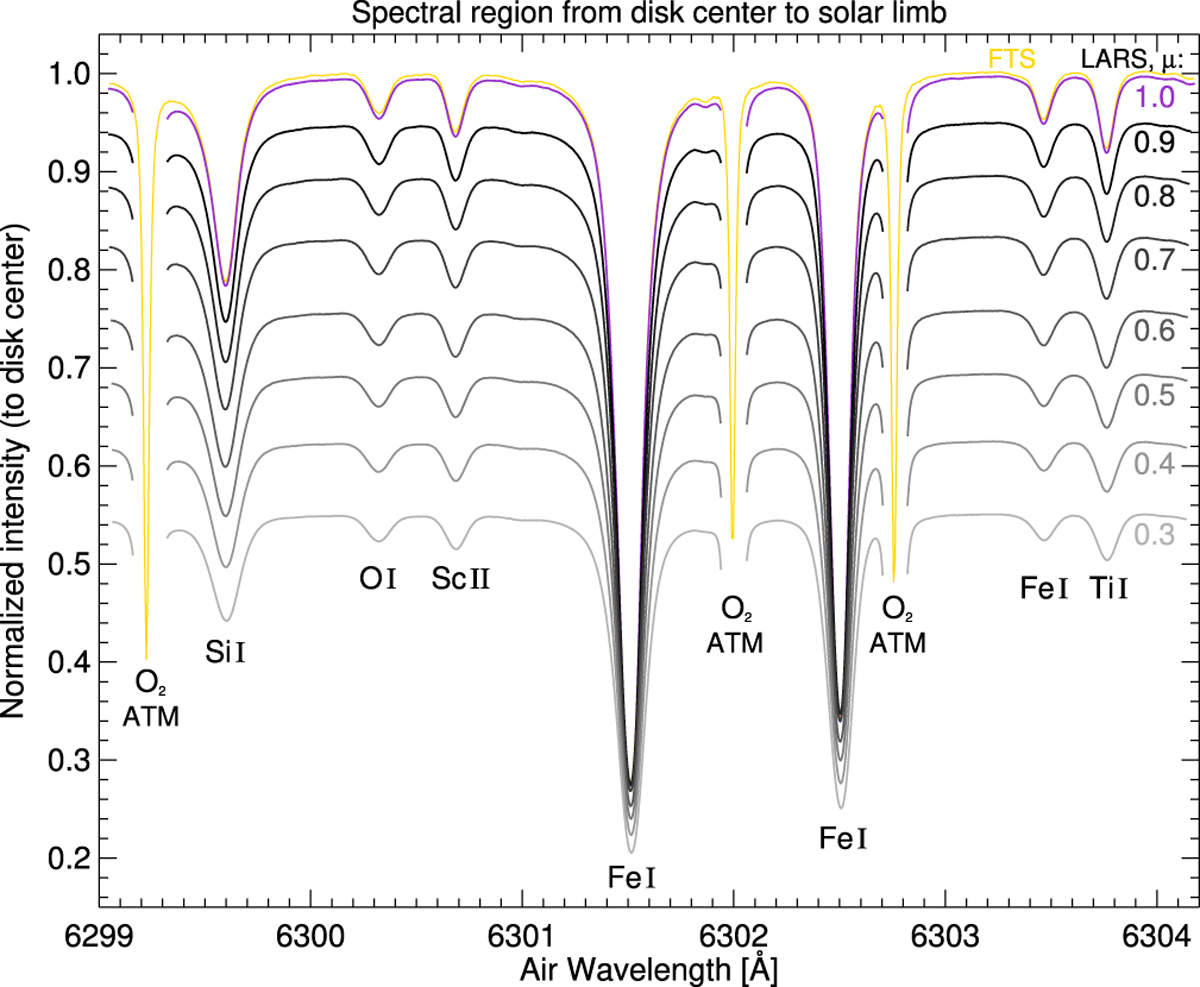
Solar spectrum observed with LARS in the 6302 Å region from the disk center (μ = 1.0, purple line) toward the solar limb (μ = 0.3, with decreasing gray scale). The spectra were normalized to the continuum intensity at the disk center and are displayed against the air wavelength in Å. The FTS atlas profile is added in yellow (slight y-shifted by + 0.5% for better visualization).
Current usage metrics show cumulative count of Article Views (full-text article views including HTML views, PDF and ePub downloads, according to the available data) and Abstracts Views on Vision4Press platform.
Data correspond to usage on the plateform after 2015. The current usage metrics is available 48-96 hours after online publication and is updated daily on week days.
Initial download of the metrics may take a while.