Fig. 4
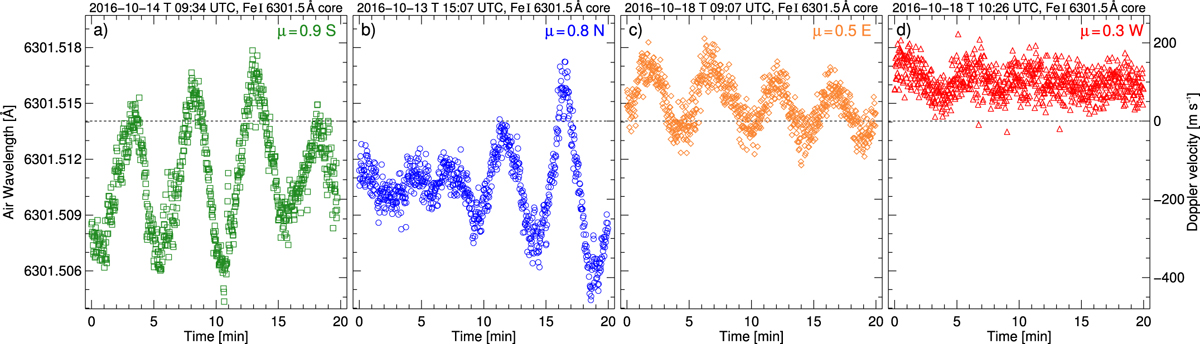
Time series of the observed line minimum position of Fe I 6301.5 Å. The characteristic evolution is shown for four sequences with different heliocentric position on the solar disk: (panel a) μ = 0.9 on the south axis (green rectangles), (panel b) μ = 0.8 on the north axis (blue circles), (panel c) μ = 0.5 on the east axis (orange diamonds), (panel d) μ = 0.3 on the west axis (red triangles). The wavelength scale (left y-axes in Å) is identical for all panels. The corresponding Doppler velocities (in m s−1 ) can be identified by the right y-axes. The zero velocity is indicated by the dotted gray line.
Current usage metrics show cumulative count of Article Views (full-text article views including HTML views, PDF and ePub downloads, according to the available data) and Abstracts Views on Vision4Press platform.
Data correspond to usage on the plateform after 2015. The current usage metrics is available 48-96 hours after online publication and is updated daily on week days.
Initial download of the metrics may take a while.