Fig. A.5
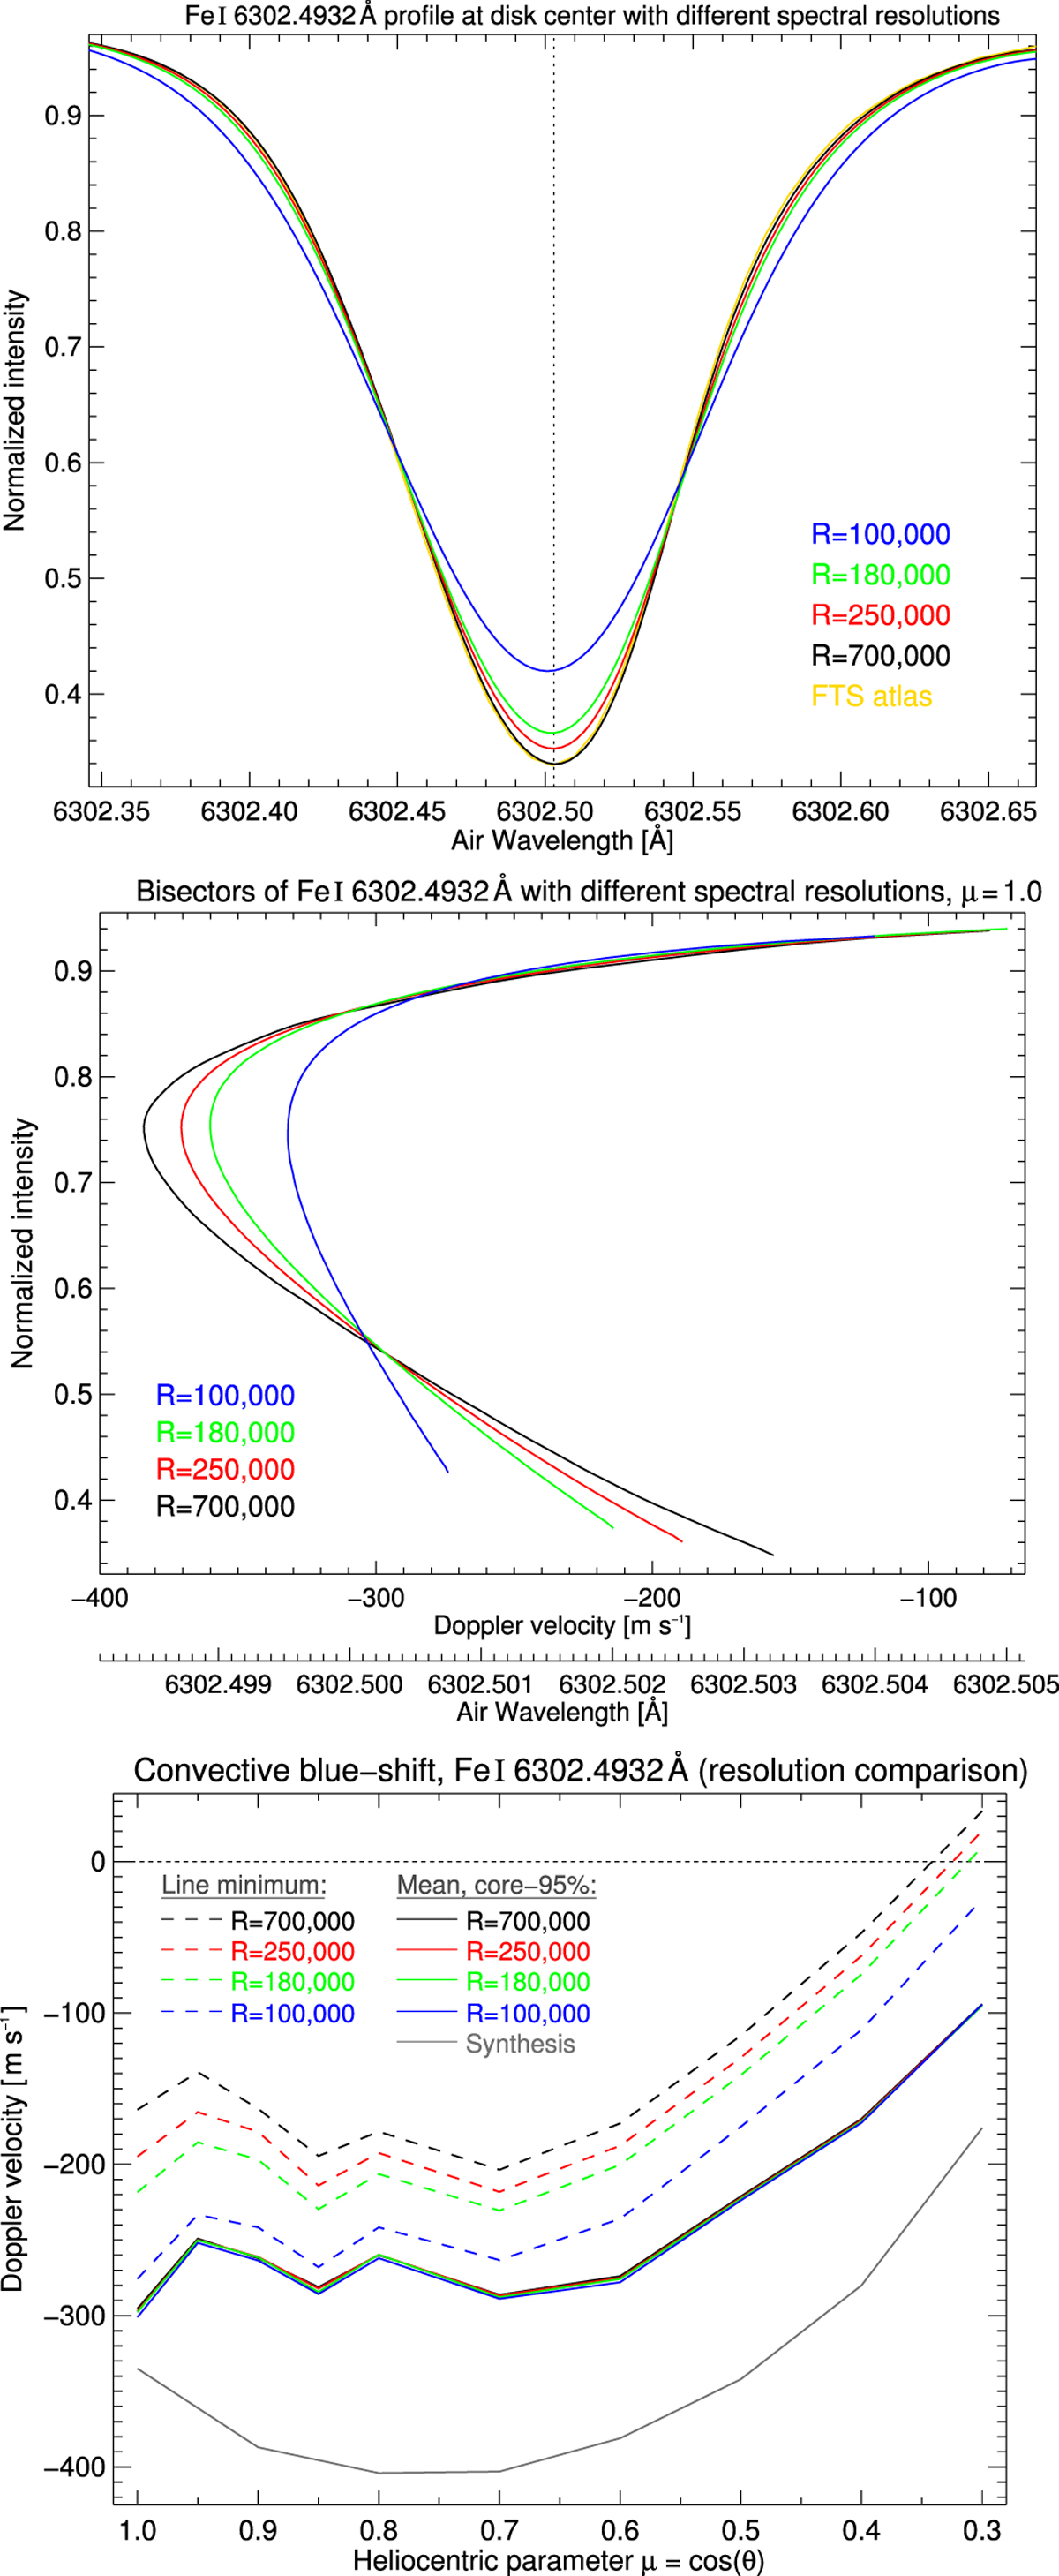
Degradation of the Fe I 6302.5 Å line analysis to lower spectral resolutions, from 700 000 (black) to 250 000 (red), 180 000 (green), and 100 000 (blue). The three panels show the change of the spectral line profile at the disk center (top panel), the corresponding bisectors (center panel), and the center-to-limb variation of the convective shift (bottom panel). The FTS atlas profile is added in yellow. Air wavelengths are given in Å, translated Doppler velocities in m s−1 . Intensities were normalized to the spectral continuum. The different center-to-limb blueshifts (lower panel) were either obtained for the line core (dashed lines) or the average bisector (solid lines).
Current usage metrics show cumulative count of Article Views (full-text article views including HTML views, PDF and ePub downloads, according to the available data) and Abstracts Views on Vision4Press platform.
Data correspond to usage on the plateform after 2015. The current usage metrics is available 48-96 hours after online publication and is updated daily on week days.
Initial download of the metrics may take a while.