Fig. A.3
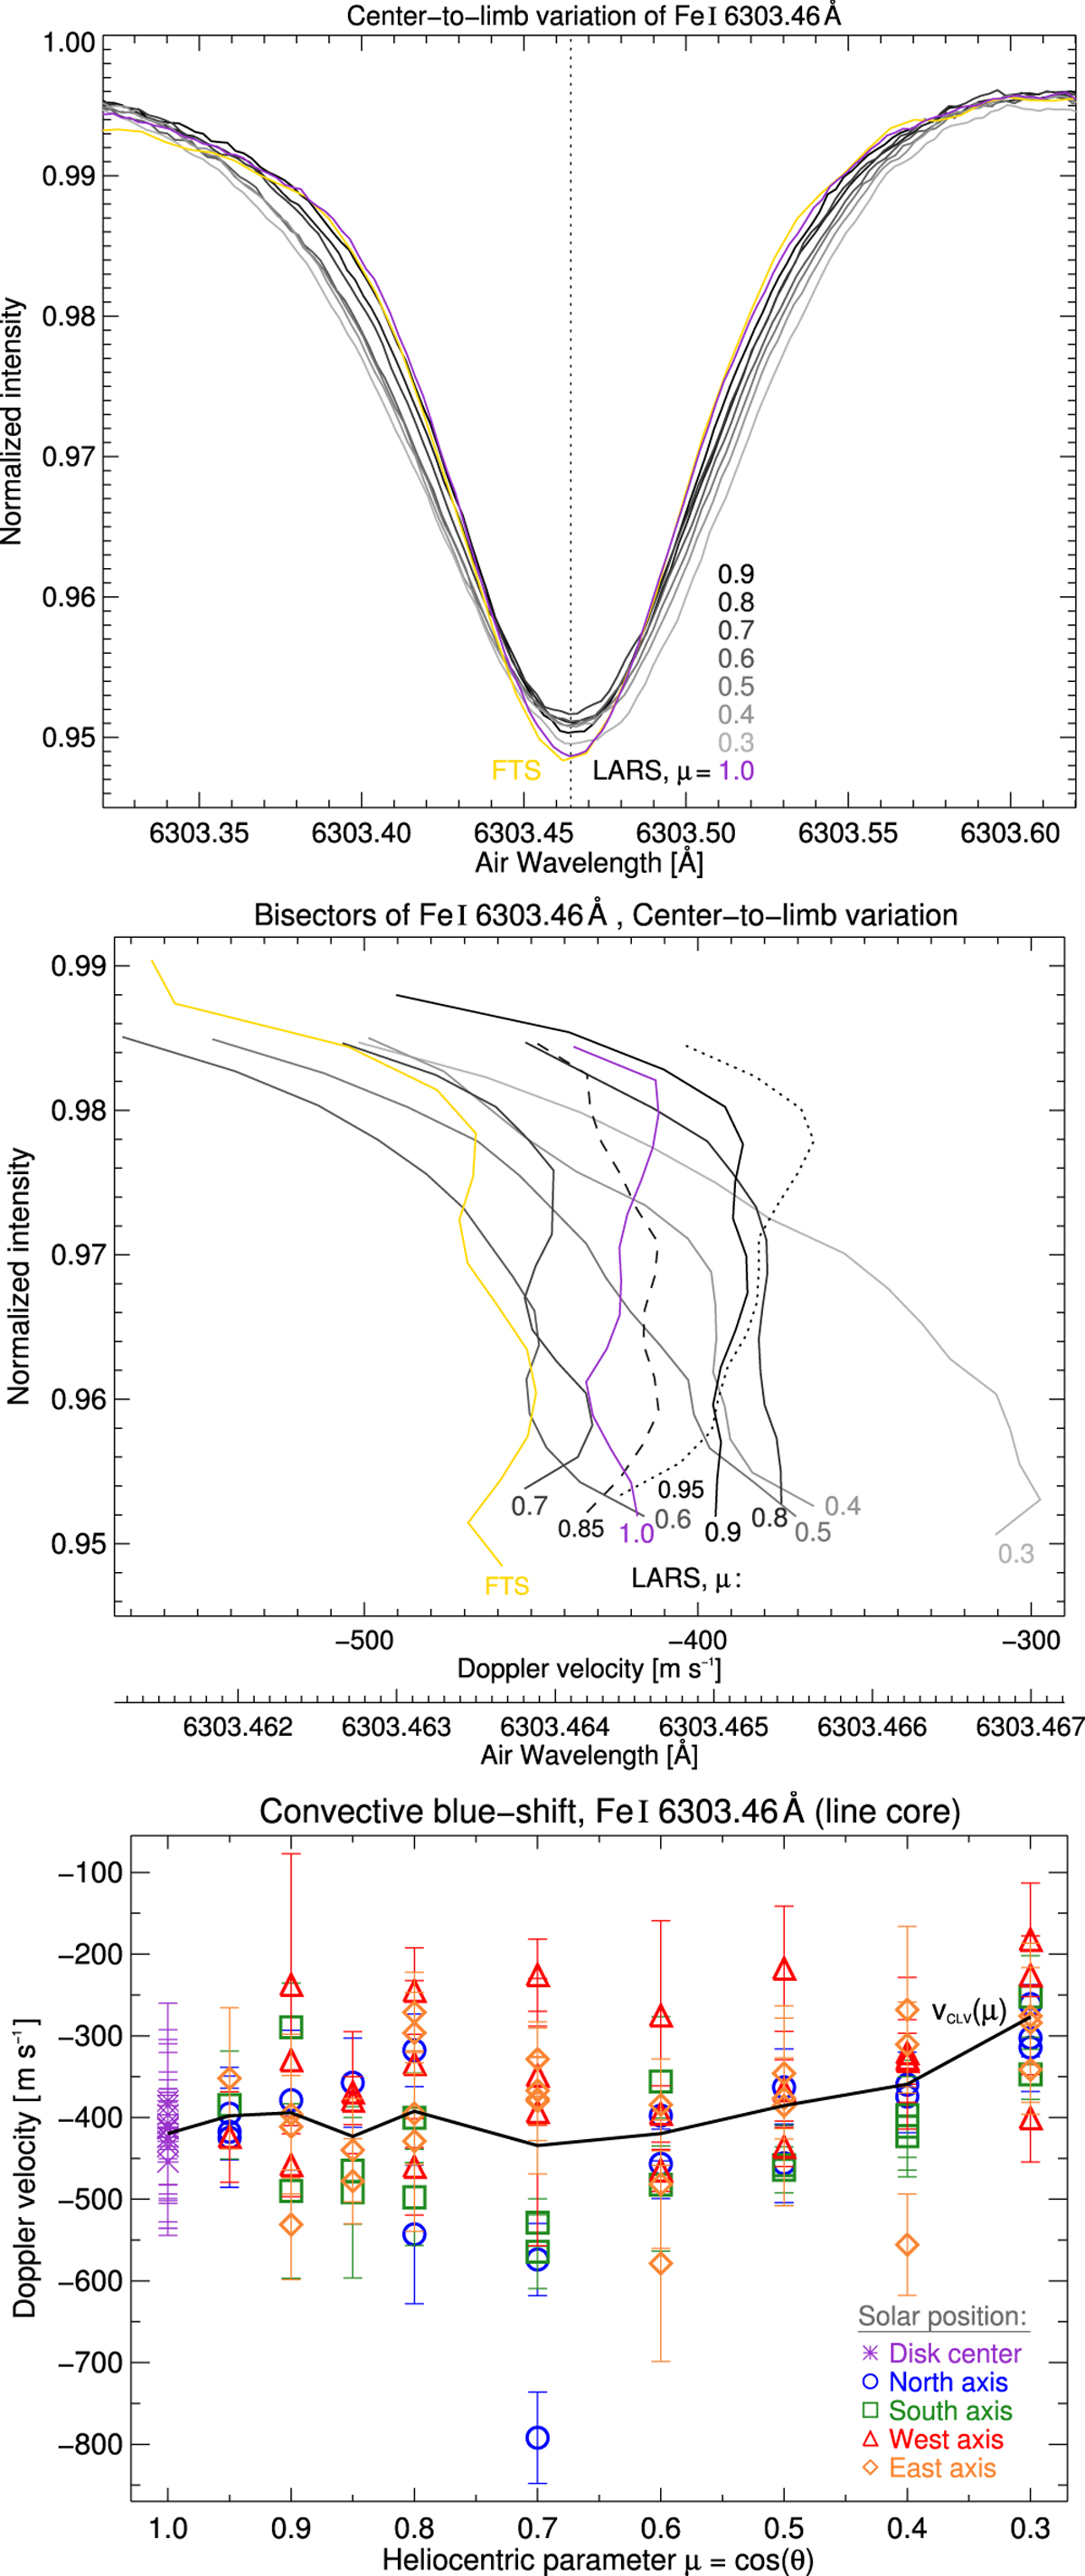
Center-to-limb variation for the Fe I 6303.5 Å line. Top and middle panel: spectral profile and bisectors from the disk center (purple) toward the solar limb (decreasing gray scale), with FTS atlas comparison (yellow). Intensities were normalized to the spectral continuum. Air wavelengths (in Å) were translated into Doppler velocities (in m s−1 ). Bottom panel: line core velocities plotted against the heliocentric position μ, with colored symbols indicating the solar axis. The average trend is drawn in black as a thick, solid line.
Current usage metrics show cumulative count of Article Views (full-text article views including HTML views, PDF and ePub downloads, according to the available data) and Abstracts Views on Vision4Press platform.
Data correspond to usage on the plateform after 2015. The current usage metrics is available 48-96 hours after online publication and is updated daily on week days.
Initial download of the metrics may take a while.