Fig. 10
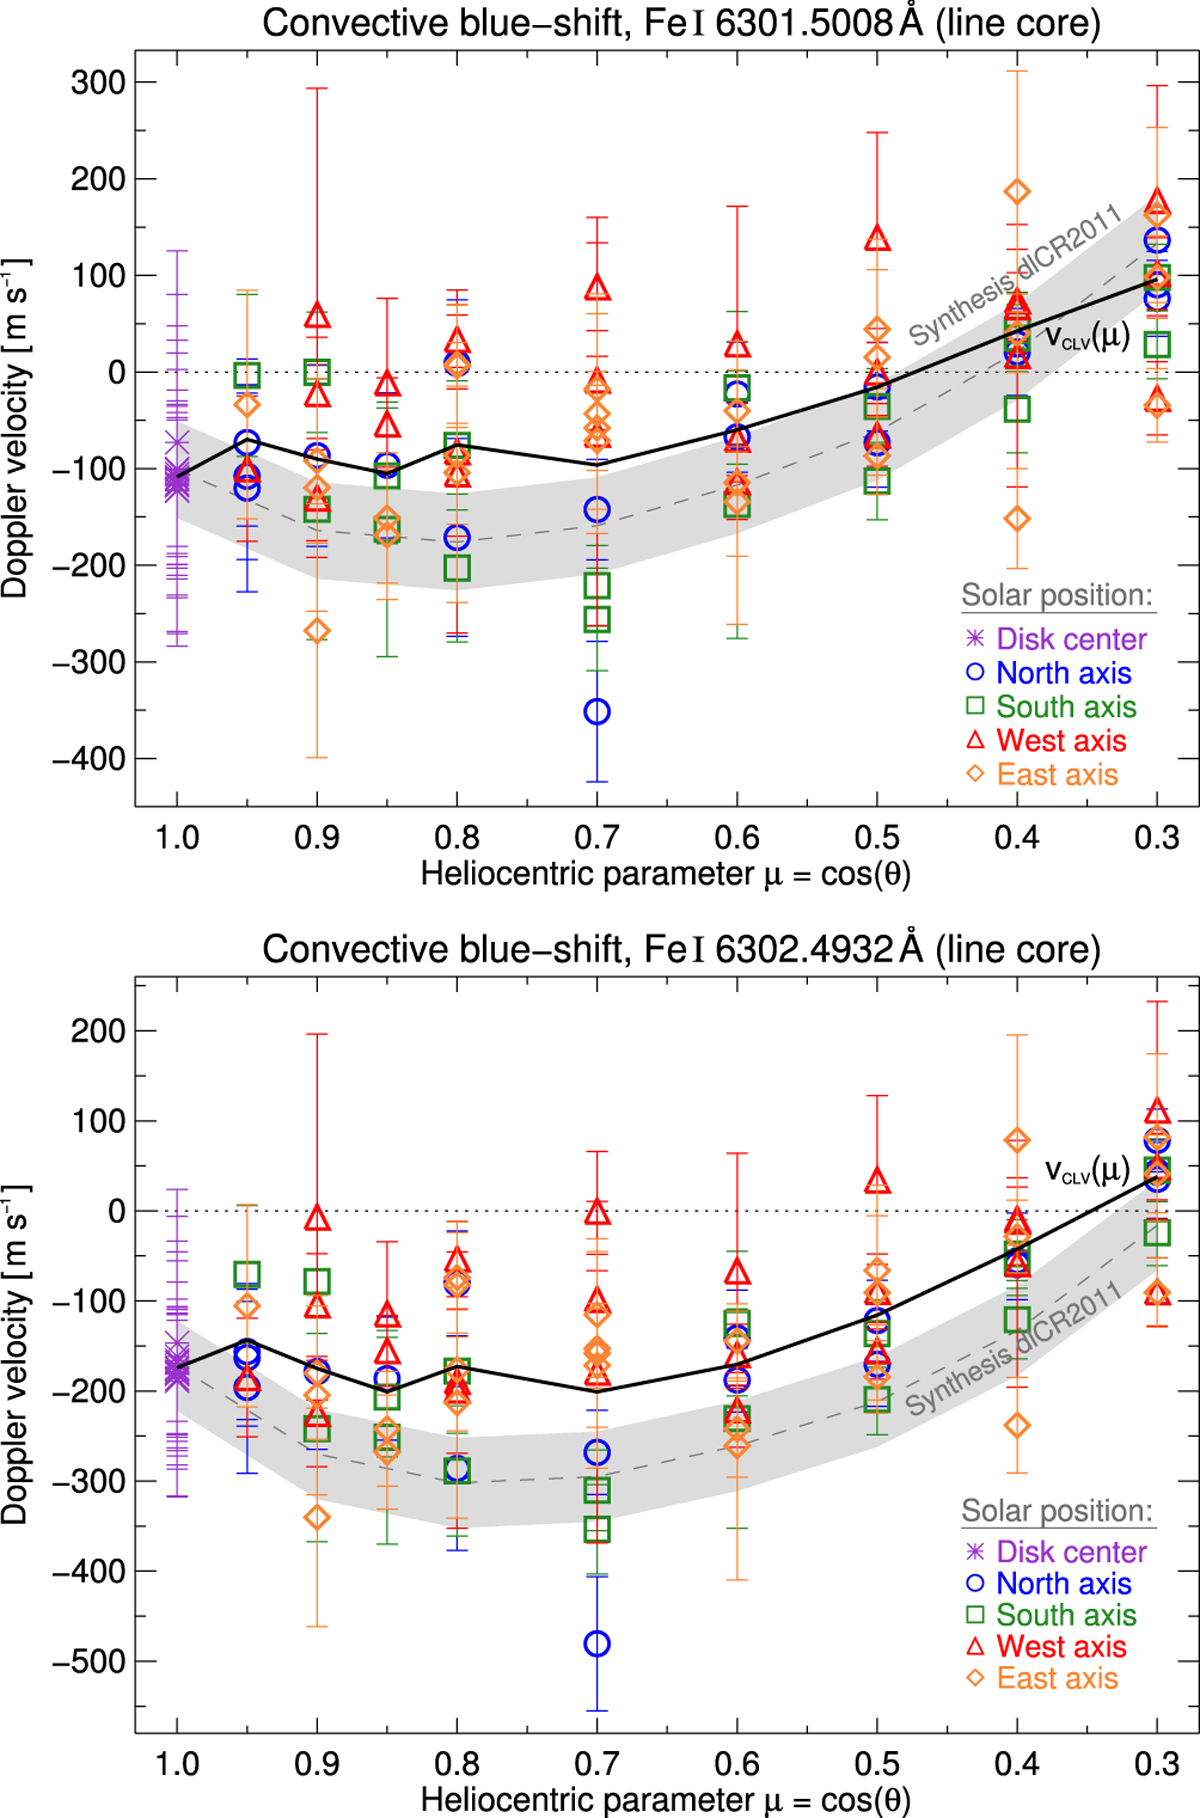
Center-to-limb variation of the convective shift. The Doppler velocities (in m s−1 ) from the line core of Fe I 6301.5 Å (upper panel) and Fe I 6302.5 Å (lower panel) are plotted against the heliocentric parameter from the disk center (μ = 1.0) toward the solar limb (μ = 0.3). The data points represent the average for each sequence. The colored symbols indicate the solar axis. The error bars show the standard deviation of the respective sequence. The black solid line displays the average curve vCLV (μ). The gray dashed line and shaded area depict the synthesis of de la Cruz Rodríguez et al. (2011) and its assumed error.
Current usage metrics show cumulative count of Article Views (full-text article views including HTML views, PDF and ePub downloads, according to the available data) and Abstracts Views on Vision4Press platform.
Data correspond to usage on the plateform after 2015. The current usage metrics is available 48-96 hours after online publication and is updated daily on week days.
Initial download of the metrics may take a while.