Fig. 4
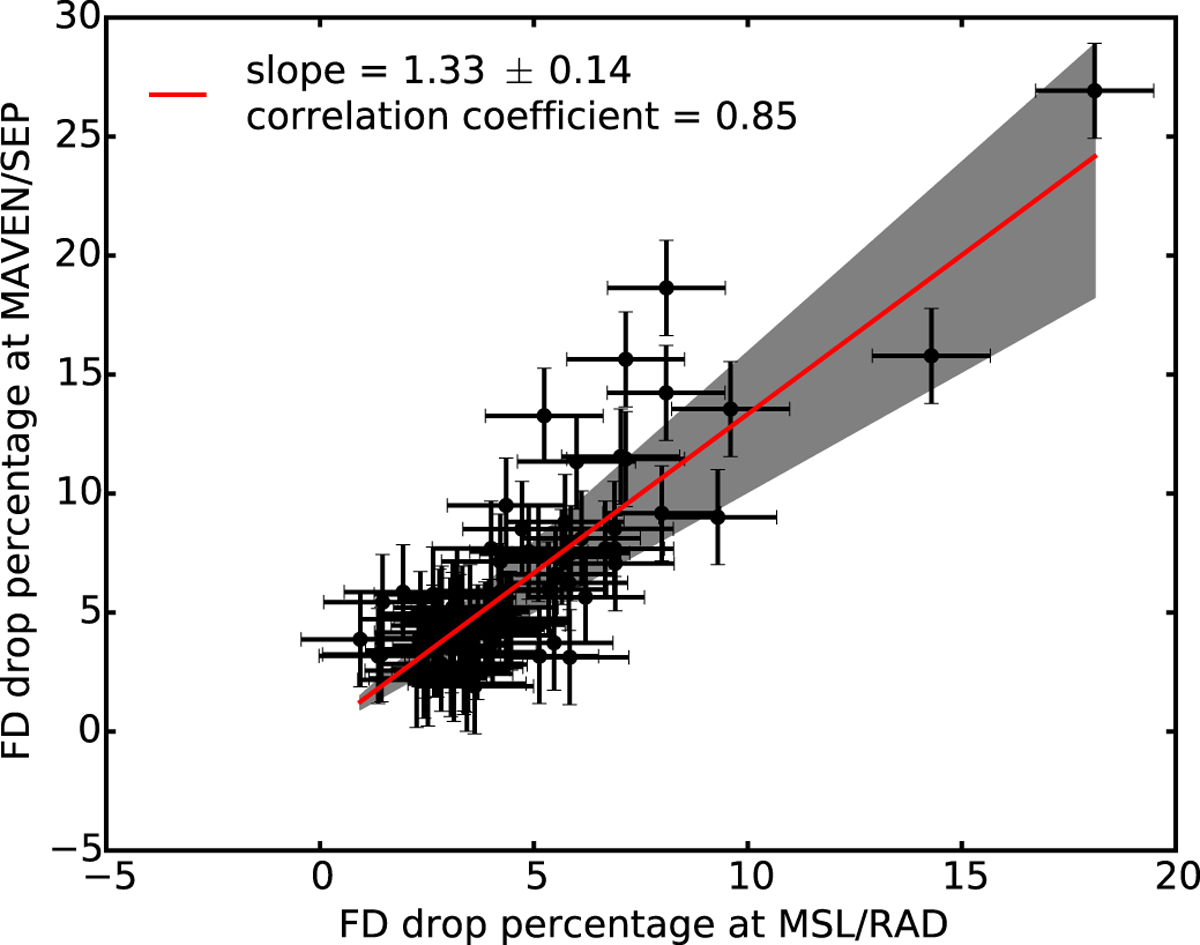
Black: the drop percentage for each FD detected by MSL/RAD on the Martian surface compared to that in the SEP/FTO integrated count rate of MAVEN orbiting Mars. Red line: the averaged ratio (slope of a linear fit) of the FD drop percentage at MAVEN to that at MSL. Gray area: the uncertainty range of the fitted slope obtained via a bootstrap Monte Carlo approach (more explains can be found in the text).
Current usage metrics show cumulative count of Article Views (full-text article views including HTML views, PDF and ePub downloads, according to the available data) and Abstracts Views on Vision4Press platform.
Data correspond to usage on the plateform after 2015. The current usage metrics is available 48-96 hours after online publication and is updated daily on week days.
Initial download of the metrics may take a while.