Fig. 3
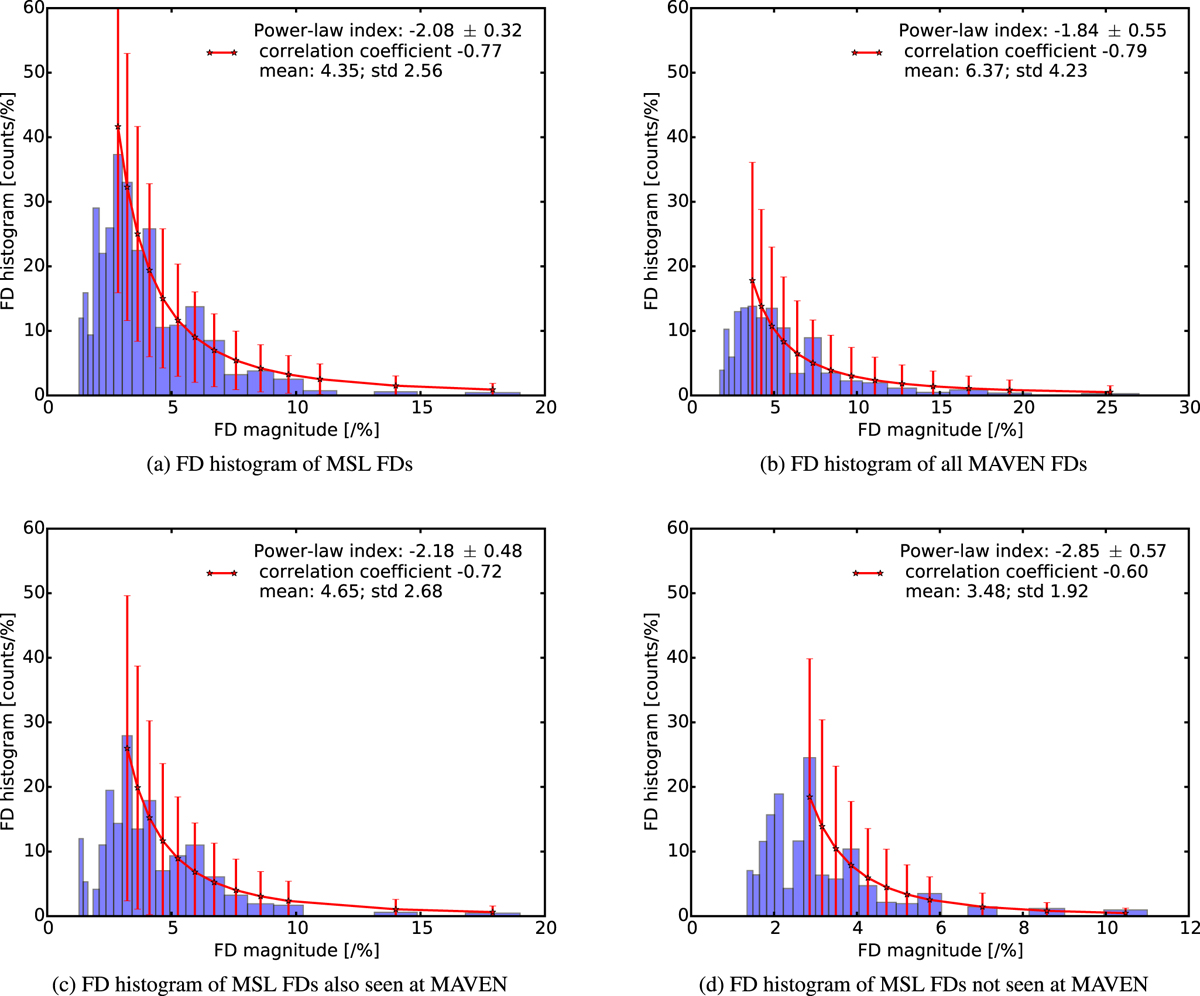
Histogram of FD magnitude at Mars. Panel a: for all FDs seen at MSL from October 2014 until September 2016; panel b: for all FDs seen at MAVEN in the same period; panel c: for FDs seen at MSL which are also seen at MAVEN and panel d: for FDs seen at MSL which are not seen at MAVEN. X-axes are the FD magnitude in units of drop percentage [%] and the bins for the histogram are in logarithmic scale. Y-axes are normalized histogram [counts per %]. The blue bars are the histogram while the red curves are the power-law fits and the fitting uncertainties. The legends show 1) the fitted indices and their uncertainties, 2) the correlation coefficient between the FD magnitudes and their distributions and 3) the mean value and the standard deviation of the FD distributions in each case.
Current usage metrics show cumulative count of Article Views (full-text article views including HTML views, PDF and ePub downloads, according to the available data) and Abstracts Views on Vision4Press platform.
Data correspond to usage on the plateform after 2015. The current usage metrics is available 48-96 hours after online publication and is updated daily on week days.
Initial download of the metrics may take a while.